|
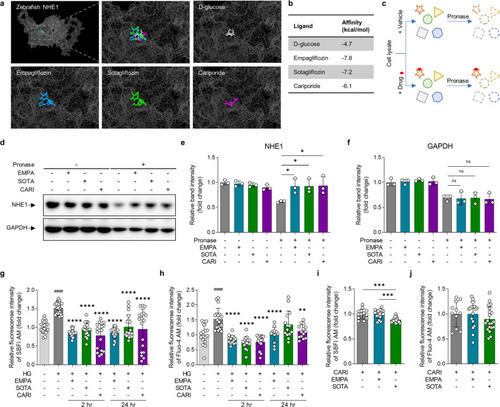
Comparison of structural binding and functional inhibitory effects of empagliflozin and sotagliflozin on NHE1. a, b Molecular docking analysis of empagliflozin, sotagliflozin, cariporide and D-glucose binding to a structural model of zebrafish NHE1 in silico. Empagliflozin is shown in blue, sotagliflozin is shown in green, cariporide is in purple, and D-glucose is in gray. D-glucose was used as a negative control, and cariporide was used as a positive control. a Binding site and b affinities. c Schematic illustration of the drug affinity responsive target stability (DARTS) assay in vitro. d–f DARTS analysis by immunoblotting with NHE1 and GAPDH antibodies (n = 3 samples per group). g–j Measurement of intracellular Na+ and Ca2+ to analyze the functional inhibitory effects of empagliflozin and sotagliflozin on NHE1. g Changes in intracellular Na+ and h Ca2+ concentrations in cardiomyocyte under HG condition were evaluated after treatment with (n = 14–27 samples per group). i, j Changes in intracellular Na+ and Ca2+ concentrations in response to empagliflozin or sotagliflozin treatment in cells pretreated with cariporide (n = 11–20 samples per group). Data are presented as the mean ± standard deviation, and each dot represents the value of each sample. e, i *p < 0.05, ***p < 0.001 vs. the indicated group. g, h####p < 0.0001 vs. the LG group, **p < 0.01, ****p < 0.0001 vs. the HG group.
|