IMAGE

Fig. 4

ID
ZDB-IMAGE-230707-123
Source
Figures for Kim et al., 2023
Image
Figure Caption

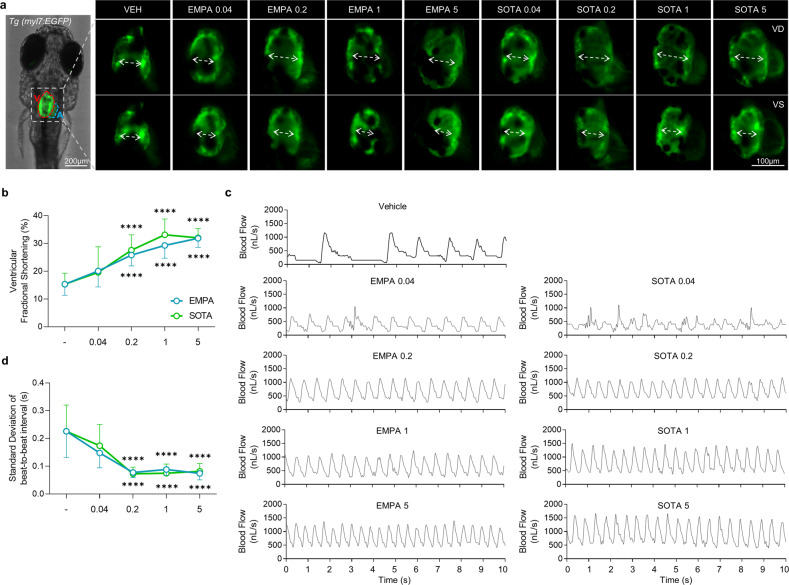
Fig. 4 Comparison of cardiac contraction in DM-HFrEF zebrafish treated with various concentrations of empagliflozin or sotagliflozin.

a Representative fluorescence microscopy images of TG (myl7:EGFP) zebrafish hearts at end-diastole and end-systole of ventricle. b Ventricular fractional shortening calculated based on fluorescent images (n = 8–25 larvae per group). c Representative blood flow graphs. d Standard deviation of the beat-to-beat interval analyzed based on blood flow (n = 14–25 larvae per group). b, d Data are presented as the mean ± standard deviation. ****p < 0.0001 vs. control group.

Acknowledgments
This image is the copyrighted work of the attributed author or publisher, and ZFIN has permission only to display this image to its users. Additional permissions should be obtained from the applicable author or publisher of the image. Full text @ Exp. Mol. Med.