
- Title
-
Apoptotic mechanism of propofol-induced developmental toxicity in zebrafish embryos
- Authors
- Ge, Y., Yuan, W., Jia, W., Guan, Z., Huang, T., Zhang, Y., Song, C., Xiao, Y., Gao, J.
- Source
- Full text @ PLoS One
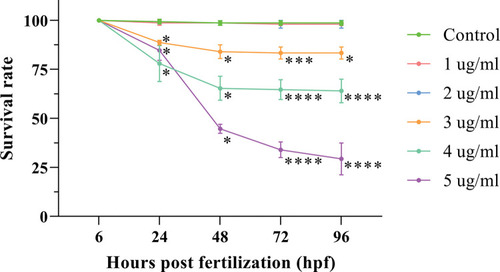
Effects of different concentrations of propofol on the survival rate of zebrafish embryos and larvae. Statistical analyses were performed between different time points, and data are shown as the mean ± SD. At 24 and 48 hours post fertilization (hpf), the data were compared by multiple independent samples nonparametric tests with Bonferroni correction. At 72 and 96 hpf, ANOVA with Bonferroni correction was used. * indicates that the related group was compared with control group at the same time point. Three independent experiments of 50 embryos for each group were carried out. Three independent experiments were carried out. *P < 0.05, **P < 0.01, ***P < 0.001, ****P < 0.0001. |

Hatchability and heart rate between two groups. (A-D) 48 and 72 hpf zebrafish in 90 mm dishes of the two groups. (E) The hatchability of zebrafish at each stage; Four independent experiments of 50 embryos for each group were carried out; ANOVA with Bonferroni correction. (F) Heart rate of zebrafish at each stage; n ≥ 7 for each group; two-way ANOVA with Bonferroni correction. Different letters indicate a significant difference between different time points for the same group (P < 0.05). # indicates a significant difference between the control group and the 2 μg/ml propofol group at this time point (P < 0.05). dpf, days post fertilization. |
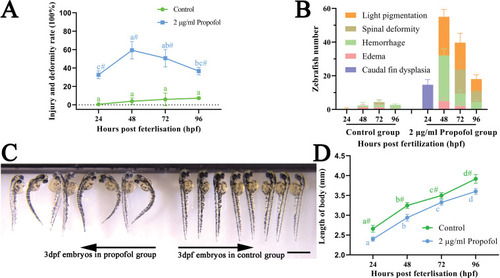
Developmental toxicity induced by 2 μg/ml propofol. (A) Injury and deformity rate from 24 hpf to 96 hpf in zebrafish. Three independent experiments of 50 embryos for each group were carried out; repeated measures ANOVA with Bonferroni correction. (B) Changes of specific types of deformities and injuries with the growth and development of zebrafish. Three independent experiments of 50 embryos for each group were carried out. (C) Image of 3 dpf zebrafish under a stereoscope microscope; scale bar = 1 mm; magnification = ×10. (D) Body length of zebrafish from 24 hpf to 96 hpf; n = 7 for each group; two-way ANOVA with Bonferroni correction. (A, D) No same letter indicates a significant difference between different time points for the same group (P < 0.05); # indicates a significant difference between the control group and the 2 μg/ml propofol group at this time point (P < 0.05). |
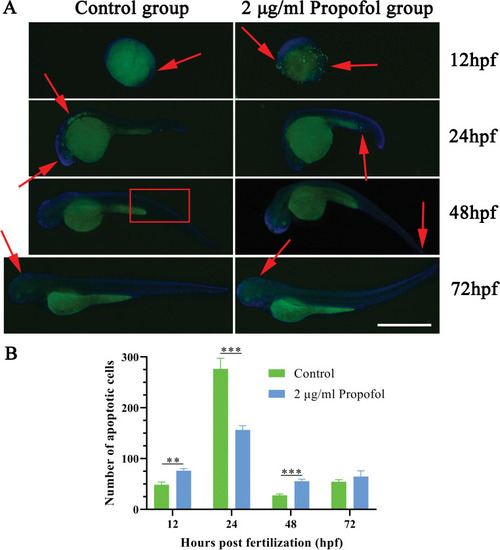
Result of terminal deoxynulceotidyl transferase nick-end-labeling (TUNEL) staining. (A) The merged image of signals for fluorescein isothiocyanate (FITC) (apoptotic cells) and 4′,6-diamidino-2-phenylindole (DAPI) (nucleus); red arrows and boxes represent site of apoptosis aggregation; scale bar = 1 mm, magnification = ×40. (B) Number of apoptotic cells; Independent sample t-test; n = 3; *P < 0.05, **P < 0.01, ***P < 0.001. |

Apoptotic gene expression induced by propofol. (A) Pro-apoptotic gene expression significantly induced by propofol. (B) Anti-apoptotic gene expression induced by propofol. (C) The expression of pro-apoptotic genes only in the intrinsic pathway induced by propofol. An independent sample t-test was used to compare the mRNA expression in the two groups at the same time point. Three independent experiments were carried out. *P < 0.05, **P < 0.01, ***P < 0.001, ****P < 0.0001. |
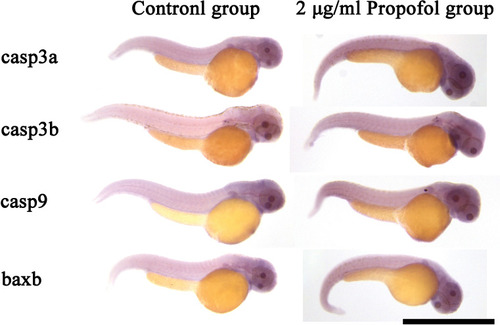
Result of whole-mount The intensity of the color indicates the level of mRNA expression of the corresponding gene. Scale bar = 1 mm. Magnification = ×50. |