
- Title
-
L-Tyrosine Limits Mycobacterial Survival in Tuberculous Granuloma
- Authors
- Gao, Y., Li, J., Guo, X., Guan, L., Wang, J., Huang, X., Wang, W., Yang, H.
- Source
- Full text @ Pathogens
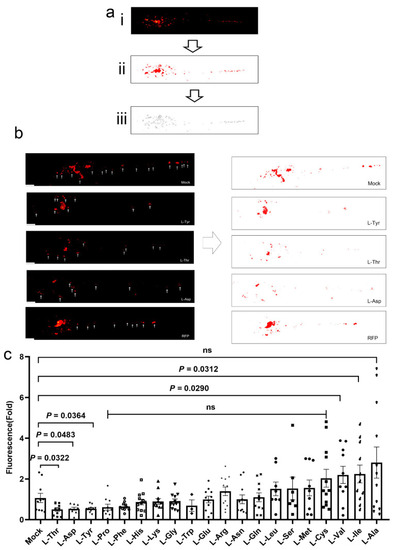
L-Asp, L-Thr, and L-Tyr inhibit M. marinum proliferation in zebrafish larvae. (a) Process used to calculate bacterial burden in larvae. Original image (i); image after fluorescence pixelation—red pixels represent relative bacterial burden size (ii); area calculation (iii). (b) Images showing M. marinum burden distribution in wild-type zebrafish larva treated with control, RFP, L-Asp, L-Tyr, and L-Thr (10 μM) for 3 days. White arrows show M. marinum infection areas. (c) Bacterial burden in M. marinum-infected larvae treated with control, RFP (10 μM), or amino acids (10 μM) for 3 days. Individual values are indicated in a scatter dot plot in (c). Student’s t-tests (c) were used. p < 0.05 was statistically significant. Scale bar = 200 μm in (b). |
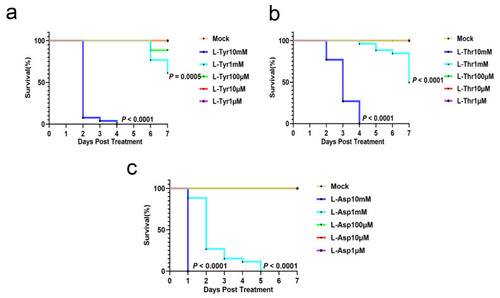
L-Asp, L-Thr, and L-Tyr do not affect zebrafish larvae development. Larvae mortality rates when exposed to different L-Tyr (a), L-Thr (b), and L-Asp (c) concentrations from 0 to 7 days post- fertilization (n = 26/group). The Kaplan–Meier method (a–c) was used for analysis. |
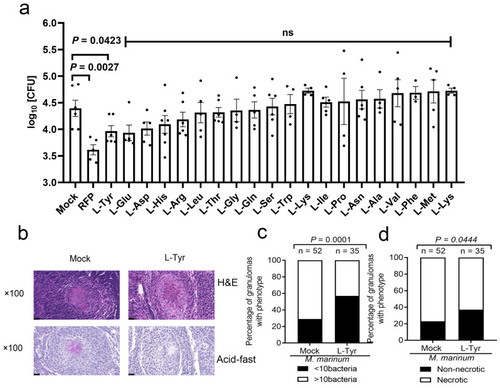
L-Tyr reduces M. marinum levels in adult zebrafish granulomas. (a) Adults were intraperitoneally infected with approximately 400 CFUs of wild-type M. marinum strain/fish for 14 days. Adults were orally administered daily with 20 amino acids (effective concentrations) for 1 week before infection and for 2 weeks after infection. As a positive control, at 7 days post-infection (dpi), fish were orally administered RFP (50 mg/kg) daily until 14 dpi. (b) Histopathology showing whole fish sections and bacterial titers. Hematoxylin and eosin or acid-fast staining shows zebrafish infected for 14 days and granuloma comparisons between M. marinum-infected adults treated with/without L-Tyr and scored for M. marinum burden (> or <10 bacteria) or (c) necrotic granuloma percentages in fish (d). Individual values are shown with scatter dot plots in Student’s t-tests (a), and Fisher’s exact tests (c,d) were used for analyses. Scale bar = 20 μm in (b). |
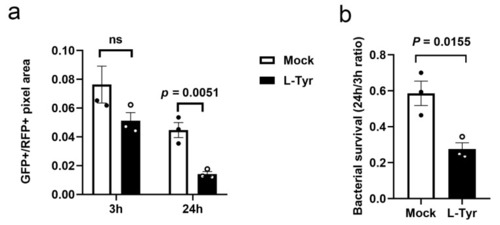
L-Tyr reduces intracellular M. tuberculosis (Mtb) survival. Macrophages pretreated with control or L-Tyr (10 μM) were infected with Mtb at indicated times and subjected to survival analyses (a,b). Survival rates were estimated by dividing total intracellular GFP-positive signals by total intracellular mCherry-positive signals (a). Survival ratios were calculated by dividing the results at 24 h to those at 3 h (b). Individual values are shown in scatter dot plots in (a, |
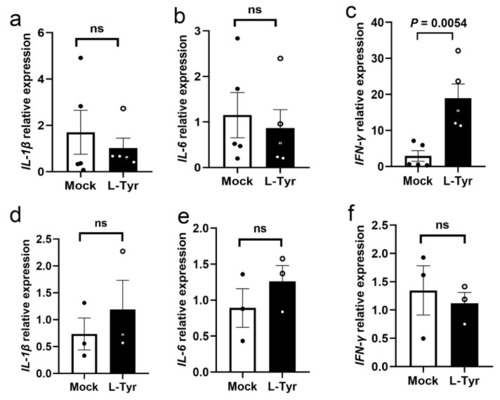
L-Tyr affects proinflammatory cytokine expression. qRT-PCR analysis of IL-1β (a), IL-6 (b), and IFN-γ (c)mRNA expression in controls or L-Tyr (1 mM)-pretreated adult zebrafish intraperitoneally infected with M. marinum. qRT-PCR analysis of IL-1β (d), IL-6 (e), and IFN-γ (f) mRNA expression in controls or L-Tyr (10 μM)-pretreated zebrafish larvae infected with M. marinum. Individual values are shown in a scatter dot plot in (a–f). Student’s t-tests (a–f) were used for analyses. |
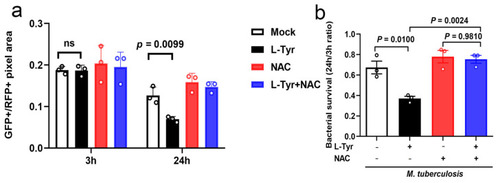
L-Tyr inhibits M. tuberculosis (Mtb) intracellular survival via ROS. Macrophages pretreated with L-Tyr (10 μM) or NAC (5 mM) were infected with Mtb at indicated times and subjected to survival analyses. MPMs and Mtb residents were imaged using fluorescence microscopy. Survival rates were calculated by dividing total intracellular GFP-positive signals by total intracellular mCherry-positive signals (a). Survival ratios were calculated by dividing the results at 24 h to those at 3 h (b). Individual values are shown in a scatter dot plot in (a,b). Student’s t-tests (b) were used for analyses. |