
- Title
-
Microenvironmental control of hematopoietic stem cell fate via CXCL8 and protein kinase C
- Authors
- Binder, V., Li, W., Faisal, M., Oyman, K., Calkins, D.L., Shaffer, J., Teets, E.M., Sher, S., Magnotte, A., Belardo, A., Deruelle, W., Gregory, T.C., Orwick, S., Hagedorn, E.J., Perlin, J.R., Avagyan, S., Lichtig, A., Barrett, F., Ammerman, M., Yang, S., Zhou, Y., Carson, W.E., Shive, H.R., Blachly, J.S., Lapalombella, R., Zon, L.I., Blaser, B.W.
- Source
- Full text @ Cell Rep.

Transcription of prkcda is repressed in the vascular niche and dysregulated expression of prkcda expands phenotypic HSPCs (A) Representative images of the kdrl:EGFP; lyve1b:DsRed transgenic line. Bar, 100 μm. (B) Volcano plot indicating genes with significantly differentially regulated genes in red; prkcda and selected CHT-specific genes are shown. Positive absolute log fold change (ALFC) indicates upregulation in CHT-derived sinusoidal endothelial cells compared to non-CHT-derived arteriovenous endothelial cells. (C) Differential expression of PKC-family genes in CHT-derived and non-CHT-derived endothelial cells. Values represent average fragments per kilobase of exon per million mapped fragments (FPKM) from three biological replicates. For prkcda, p = 0.00035. (D–F) Whole-mount in situ hybridization for prkcda in 72-hpf zebrafish embryos. (E and F) Flow cytometric analysis of kdrl:EGFP;sele:prkcda-2A-mCherry (E) and Runx1:EGFP;sele:prkcda-2A-mCherry (F) embryos. (G and H) Representative images of kdrl:EGFP zebrafish embryos injected (G) or not (H) with the sele:prkcda-2A-mCherry expression construct. Bar, 100 μm. (I) Dysregulated expression of prkcda in Runx1:EGFP;sele:prkcda-2A-mCherry embryos expands HSPCs. Each PKC family member is compared to clutchmates injected with a vector containing an empty multiple cloning site (control). Data are presented as fold change relative to control for each clutch (two or three clutches analyzed per PKC family member; each point represents a biological replicate). Boxes represent mean ± SEM. Prkcda vs. control: 1.94 ± 0.3-fold increase, p = 0.0092, Welch’s t test. (J) Representative images of CHT colonization in control and prkcda groups. Dotted lines indicate the CHT. Bar, 100 μm. (K and L) Representative images of kdrl:EGFP(+) sele:prkcda-2A-mCherry(+) (K) and kdrl:EGFP(+); sele:prkcda-2A-mCherry(−) (L) transgenics. Bar, 100 μm. (M) Phenotypic HSPCs were quantified in stable Runx1:EGFP;sele:prkcda-2A-mCherry transgenics (+) and Runx1:EGFP clutchmates (−) at 72 hpf. Data are pooled from two independent clutches and are represented as fold change relative to (−). Boxes represent mean ± SEM; each point represents a biological replicate. + vs. −: 1.19 ± 0.08-fold increase, p = 0.014, Wilcoxon rank-sum test. (N) Representative images of CHT colonization for the (−) and (+) animals from Figure 1G. Dotted lines indicate CHT. (O) Phenotypic HSPCs were quantified in Runx1:EGFP transgenics treated with HA-100 or an equivalent volume of DMSO as a vehicle control. Data are pooled from two independent experiments and are shown as fold change relative to control. Box represents mean ± SEM; each point represents a biological replicate. HA-100 vs. control: 0.38 ± 0.06-fold decrease, p = 8.3 × 10⁻⁶, Wilcoxon rank-sum test. See also Figure S1 and Table S1. |

Vascular niche expression of prkcda increases the number of long-term HSC clones (A) Schematic outline of the long-term fate-mapping experiment. (B) GESTALT barcodes were amplified from peripheral blood samples and quantified using SABER. The number of HSC clones at each time point is shown for sele:prkcda-2A-mCherry transgenics (prkcda) and clutchmate controls. Representative data from one of two experiments is shown. Boxes indicate mean ± SEM; each point represents a biological replicate. For 3 mpf to 22 mpf, prkcda vs. control: p = 0.0008, robust two-way mixed ANOVA. Post hoc testing for prkcda vs. control at 6 and 9 mpf: 6.5 ± 0.7 vs. 3.6 ± 0.4 HSC clones, p = 0.001 and 7.0 ± 0.8 vs. 4.2 ± 0.8 HSC clones, p = 0.02, Welch’s t test. (C) Correlation of serial samples to baseline for GESTALT barcode-identified fish. Each row per column represents a biological replicate. (D) The Pearson correlation for each fish is plotted by group and by time point (6 mpf and later). Boxes represent mean ± SEM; each point represents a biological replicate. For prkcda vs. control: mean Pearson coefficient of 0.58 ± 0.11 vs. 0.90 ± 0.03, p = 0.03, Welch’s t test. (E) Representative plots showing HSC clonal dynamics in control and prkcda groups. The height of each polygon at the indicated time points is proportional the measured frequency of alleles derived from uniquely-barcoded HSC clones. Only HSC clones with a contribution of 2% or greater are included. |

Polyclonal expansion of erythroid precursors and immature neutrophils in zebrafish with dysregulated expression of prkcda (A) Uniform Manifold Approximation and Projection (UMAP) plot of hematologic cell clusters. All data points for the indicated clusters are shown; data are from n = 9 (control) and n = 10 (prkcda) pooled kidney marrows. (B) UMAP plot of hematologic cell clusters stratified by experimental group; colors indicated local cell density in two-dimensional UMAP space. (C) Expression of selected canonical genes within each hematopoietic cell cluster. (D) Differential representation of experimental groups by hematologic cell cluster. Values were normalized to the number of cells recovered for each experimental group. For prkcda compared to control by cluster: lymphoid, 1.15-fold expansion, p = 0.049; erythroid, 7.99-fold expansion, p = 3.3 × 10−111; neutrophil 1, 2.68-fold expansion, p = 4.56 × 10−91; and pro-neutrophil, 137-fold expansion, p = 3.82 × 10−88, Fisher’s exact test. (E) UMAP representation of GESTALT barcodes mapped to single hematopoietic cells. Colored points indicate biological replicates. Gray circles indicate cells without barcoding data. (F) Clonal contribution to the hematologic cell clusters is indicated by the colored bars. Each color represents a uniquely defined GESTALT clone. See also Figure S2 and Tables S2–S4. |
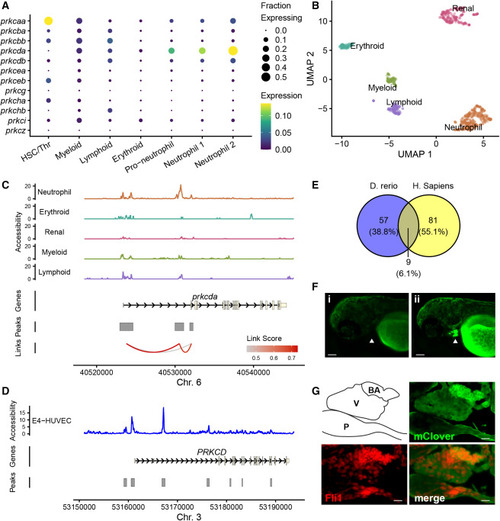
Regulation of prkcda expression by an intronic enhancer element (A) Expression of PKC isoforms in kidney marrow cell clusters identified in Figure 3. (B) UMAP representation of global chromatin accessibility in single zebrafish kidney marrow cells. Samples are from the same kidney marrow pools shown in Figure 3. (C) Chromatin accessibility at the prkcda locus in kidney marrow cells by cluster. Peaks of chromatin accessibility and Cicero links identifying co-accessible peaks are shown. (D) Bulk ATAC sequencing showing chromatin accessibility at the human PRKCD locus in E4-HUVEC cells. Peaks were identified using MACS2. (E) FIMO analysis of zebrafish and human intron enhancer peak sequences. The number of putative binding sites with q < 0.05 in each set is indicated. (F) Expression of an mClover reporter construct driven by the zebrafish prkcda intronic enhancer in uninjected (i) and injected (ii) animals. Arrowhead indicates the bulbus arteriosus. Bar, 25 μm. (G) Immune fluorescence in a 72 hpf zebrafish embryo expressing the prkcda intronic enhancer reporter. Cryosections were probed with anti-GFP/mClover and anti-Fli1 antibodies and fluorescent secondaries (see STAR Methods). The outline indicates pericardium (P), ventricle (V), and bulbus arteriosus (BA, cardiac outflow tract). Bar, 10 μm. See also Figure S3 and Video S1. |
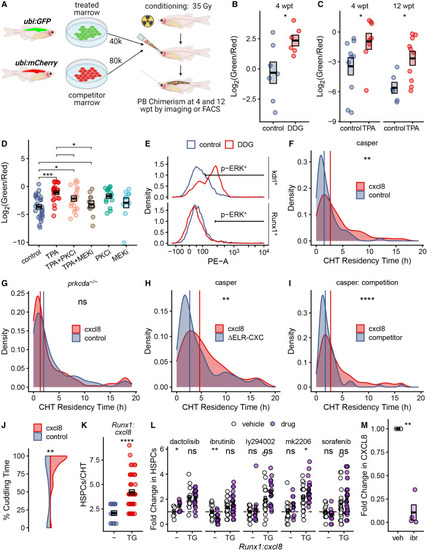
PKC agonists augment HSPC engraftment and niche colonization in competition assays (A) Schematic illustration of competitive marrow transplant experiments. (B–D) Competitive transplant data are presented as Log2(green/red) where green/red is the calculated ratio of drug- or control-treated marrow to untreated competitor marrow. Boxes represent mean ± SEM; each point is a biological replicate. (B) DDG vs. vehicle control at 4 wpt: DDG:competitor ratio 6.58 ± 2.18 vs. control:competitor ratio 2.11 ± 1.12, p = 0.026, Welch’s t test. (C) TPA vs. vehicle control at 4 wpt: TPA:competitor ratio 0.99 ± 0.31 vs. control:competitor ratio 0.24 ± 0.07, p = 0.027, Wilcoxon rank-sum test. 12 wpt: TPA:competitor ratio 0.34 ± 0.11 vs. control:competitor ratio 0.03 ± 0.01, p = 0.016, Wilcoxon rank-sum test. (D) TPA treatment in the presence or absence of PKC and MEK inhibitors, vs. control. TPA vs. TPA+MEKi: TPA:competitor ratio 0.71 ± 0.13 vs. TPA+MEKi:competitor ratio 0.22 ± 0.08, p = 0.018, Wilcoxon rank-sum test. (E) ERK phosphorylation was assessed by intracellular flow cytometry in sorted kdrl+ endothelial cells and Runx1+ HSPCs. (F) Distribution of CHT residency times for n = 46 HSPCs from Runx1:cxcl8 transgenics and n = 62 HSPCs from control clutchmates. Vertical lines indicate the median for each group. Representative data from one of four similar experiments is shown. For cxcl8 vs. control: median of 2.67 vs. 1.5 h, p = 0.003, Wilcoxon rank-sum test. (G) Distribution of CHT residency times for Runx1:cxcl8 transgenics and control clutchmates in the prkcda(−/−) mutant background. n = 108 HSPCs for Runx1:cxcl8 and n = 111 HSPCs for control in 10 fish per group. (H) Distribution of CHT residency times for n = 110 HSPCs from Runx1:cxcl8 transgenics and n = 223 HSPCs from ΔELR-CXC clutchmates. Vertical lines indicate the median for each group. For cxcl8 vs. ΔELR-CXC; median of 4.66 vs. 2.66 h, p = 0.002, Wilcoxon rank-sum test. (I) Distribution of CHT residency times for n = 404 HSPCs for Runx1:cxcl8 and n = 174 HSPCs for competitor. Vertical lines indicated the median for each group. For cxcl8 vs. competitor: median of 2.75 vs. 1.75 h, p = 1 × 10⁻⁹, Wilcoxon rank-sum test. (J) Violin plots represent the percentage of time individual HSPCs were cuddled by endothelial cells within the CHT. n = 32 HSPCs for Runx1:cxcl8 and n = 108 HSPCs for control. For cxcl8 vs. control: median of 97.7% vs. 79.3% cuddling time, p = 0.0013, Wilcoxon rank-sum test. (K) Quantification of Runx1:EGFP+ HSPCs in Runx1:EGFP;Runx1:cxcl8-2A-mCherry transgenics (TG) and Runx1:EGFP clutchmates (−). Data are from one of two representative zebrafish clutches. Boxes represent mean ± SEM; each point is a biological replicate. For TG vs. −: 4.2 ± 0.27 vs. 2.1 ± 0.25 HSPCs per CHT, p = 5.5 × 10⁻⁷, Welch’s t test. (L) Quantification of Runx1:EGFP(+) HSPCs in Runx1:cxcl8-2A-mCherrytransgenics (TG) and cxcl8 transgene-negative control clutchmates (−) treated with the indicated drugs or vehicle control. Data are presented as fold change relative to control-treated, transgene-negative clutchmates and are pooled from eight independent experiments. Boxes represent mean ± SEM; each point is a biological replicate. For ibrutinib-treated cxcl8 transgene-negative zebrafish: 0.51 ± 0.08-fold relative to vehicle-treated clutchmates, p = 0.0067, Welch’s t test. (M) Quantitative RT-PCR for CXCL8 mRNA expression by THP-1 cells treated with ibrutinib or vehicle control. Four biological replicates were performed per condition; each point is the mean of three technical replicates. For ibrutinib-treated cells: 0.11 ± 0.08-fold decrease relative to vehicle control, p = 0.002, Welch’s t test. See also Figure S4. |

Cxcl8 expression by HSPCs expands niche populations and favors early-pseudotime hematopoietic cells (A) UMAP plot showing cellular populations from 96-hpf zebrafish embryos. Data are pooled from four samples derived from two clutches of Runx1:cxcl8-2A-mCherry transgenics and clutchmate controls. Each sample was a pool of 15–20 dissociated embryos. (B) Expression of population-defining niche genes. (C) Expression of selected hematopoietic and signaling factors by niche cell clusters. (D) Differential representation of niche cell clusters according to experimental group. Positive values indicate enrichment in the Runx1:cxcl8-2A-mCherry group relative to clutchmate controls. Values were normalized according to the number of cells recovered per group. Sinusoidal, p = 0.03; lepr+ MSC, p = 6.0 × 10⁻¹⁸; osteoblast, p = 0.03; fibroblast, p = 0.0005; Fisher’s exact test. (E) GSEA enrichment plot for PKC-δ transcriptional targets. Expression data are ranked by differential expression in sinusoidal endothelial cells from Runx1:cxcl8-2A-mCherry embryos compared to control. (F) The log-transformed ratio of precursor and myeloid cells to lymphoid cells is shown. Boxes indicate mean ± SEM. For cxcl8 vs. control, 3.25 ± 0.19 vs. 2.76 ± 0.16, p = 0.049, Welch’s t test. (G) Pseudotime trajectory in the hematopoietic cell partition. The root node is indicated. (H) Stratification of progenitor/myeloid cells by experimental group. (I) Distribution of progenitor/myeloid cells from Runx1:cxcl8 transgenics and control clutchmates according to pseudotime. For cxcl8 vs. control, p = 3.4 × 10⁻⁵, two-sample Kolmogorov-Smirnov test. (J) Differential representation of niche cell clusters according to experimental group. Positive values indicate enrichment in the Runx1:cxcl8-2A-mCherry group relative to clutchmate controls. Values were normalized according to the number of cells recovered per group. Osteoblast, p = 0.0029; fibroblast, p = 2.7 × 10⁻⁵; sinusoidal endothelial cells, p = 0.013; Fisher’s exact test. See also Figures S5 and S6 and Tables S2–S4. |

CXCL8 links PKC-δ to the focal adhesion complex (A) E4-HUVEC and parental HUVEC cells were treated with rhCXCL8 (10 ng/mL) for the indicated times. The black triangle indicates the ∼130-kDa form of p-PKC-δ and the white triangle indicates the ∼78-kDa form. (B) Immunoprecipitation (IP) for p-PKC-δ with immunoblotting for p-paxillin and actin is shown. Input lysate is indicated by (+); (−) indicates beads-only control. Treatment was with 10 ng/mL rhCXCL8 or PBS for 30 min. (C) E4-HUVEC or parental HUVEC cells were treated with 10 ng/mL rhCXCL8 for the indicated times and immunoblotting for p-ERK1/2 and ERK1/2 was performed. (D) E4-HUVEC cells were transduced with lentivirus expressing shRNA against PRKCD or scramble control. Immunoblotting for p-ERK1/2 and ERK1/2 was performed. (E) shRNA knockdown of PKC-δ expression. (F) Bulk RNA sequencing was performed in E4-HUVEC cells treated with rhCXCL8 for 6 h or PBS as a control. Significantly differentially regulated genes are shown with key hematopoietic factors highlighted. Each row indicates a biological replicate. (G) Proposed model for HSPC remodeling of the niche via CXCL8 and PKC-δ. HSPCs produce CXCL8 upon encountering the vascular niche, which signals via CXCR1, releases DAG, and activates PKC family members. Transcription of PKC-δ is normally tightly controlled in order to maintain a reserve capacity to support HSPCs. CXCL8 signaling induces association of PKC-δ with the focal adhesion complex, activating niche functions such as HSPC cuddling and growth factor production. See also Figure S7 and Table S5 and S6. |