
Fig. 3
- ID
- ZDB-IMAGE-231102-38
- Publication
- Binder et al., 2023 - Microenvironmental control of hematopoietic stem cell fate via CXCL8 and protein kinase C
- All Figures
- Figures for Binder et al., 2023
|
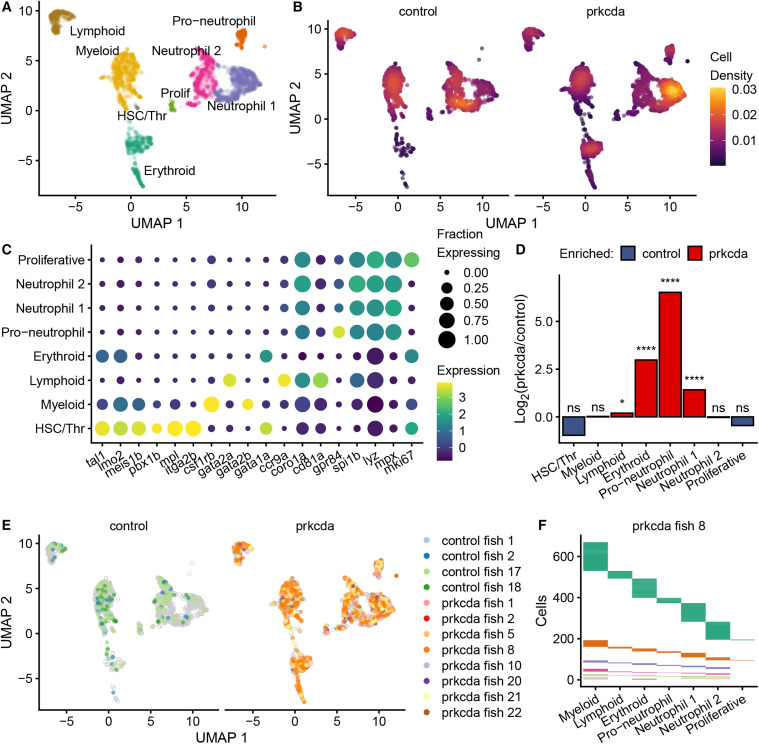
Fig. 3 Polyclonal expansion of erythroid precursors and immature neutrophils in zebrafish with dysregulated expression of prkcda (A) Uniform Manifold Approximation and Projection (UMAP) plot of hematologic cell clusters. All data points for the indicated clusters are shown; data are from n = 9 (control) and n = 10 (prkcda) pooled kidney marrows. (B) UMAP plot of hematologic cell clusters stratified by experimental group; colors indicated local cell density in two-dimensional UMAP space. (C) Expression of selected canonical genes within each hematopoietic cell cluster. (D) Differential representation of experimental groups by hematologic cell cluster. Values were normalized to the number of cells recovered for each experimental group. For prkcda compared to control by cluster: lymphoid, 1.15-fold expansion, p = 0.049; erythroid, 7.99-fold expansion, p = 3.3 × 10−111; neutrophil 1, 2.68-fold expansion, p = 4.56 × 10−91; and pro-neutrophil, 137-fold expansion, p = 3.82 × 10−88, Fisher’s exact test. (E) UMAP representation of GESTALT barcodes mapped to single hematopoietic cells. Colored points indicate biological replicates. Gray circles indicate cells without barcoding data. (F) Clonal contribution to the hematologic cell clusters is indicated by the colored bars. Each color represents a uniquely defined GESTALT clone. See also Figure S2 and Tables S2–S4.