
Fig. 5
- ID
- ZDB-IMAGE-231102-40
- Publication
- Binder et al., 2023 - Microenvironmental control of hematopoietic stem cell fate via CXCL8 and protein kinase C
- All Figures
- Figures for Binder et al., 2023
|
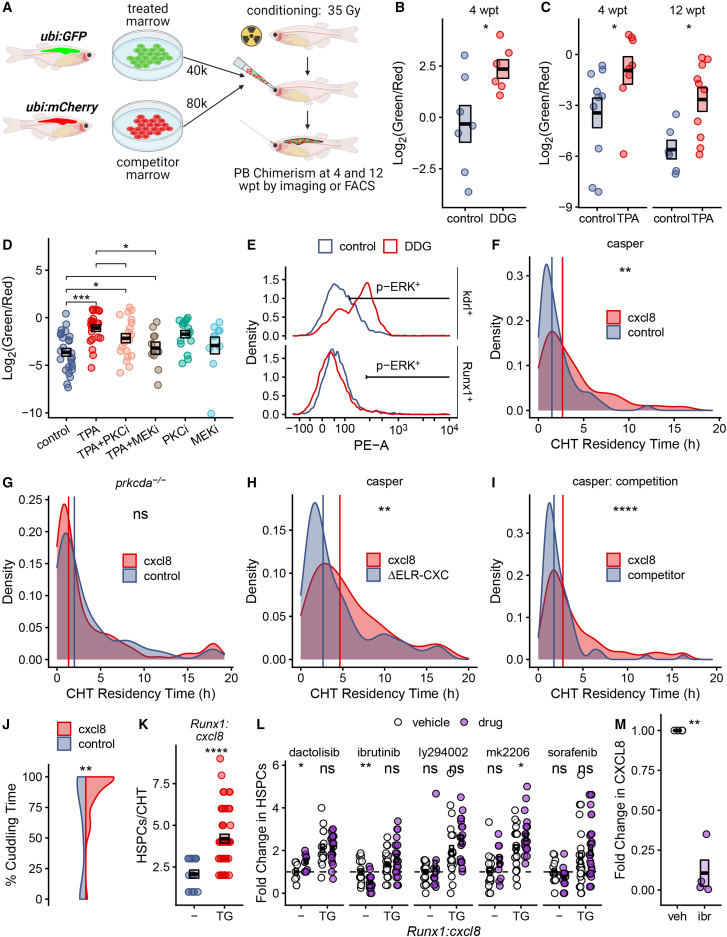
Fig. 5 PKC agonists augment HSPC engraftment and niche colonization in competition assays (A) Schematic illustration of competitive marrow transplant experiments. (B–D) Competitive transplant data are presented as Log2(green/red) where green/red is the calculated ratio of drug- or control-treated marrow to untreated competitor marrow. Boxes represent mean ± SEM; each point is a biological replicate. (B) DDG vs. vehicle control at 4 wpt: DDG:competitor ratio 6.58 ± 2.18 vs. control:competitor ratio 2.11 ± 1.12, p = 0.026, Welch’s t test. (C) TPA vs. vehicle control at 4 wpt: TPA:competitor ratio 0.99 ± 0.31 vs. control:competitor ratio 0.24 ± 0.07, p = 0.027, Wilcoxon rank-sum test. 12 wpt: TPA:competitor ratio 0.34 ± 0.11 vs. control:competitor ratio 0.03 ± 0.01, p = 0.016, Wilcoxon rank-sum test. (D) TPA treatment in the presence or absence of PKC and MEK inhibitors, vs. control. TPA vs. TPA+MEKi: TPA:competitor ratio 0.71 ± 0.13 vs. TPA+MEKi:competitor ratio 0.22 ± 0.08, p = 0.018, Wilcoxon rank-sum test. (E) ERK phosphorylation was assessed by intracellular flow cytometry in sorted kdrl+ endothelial cells and Runx1+ HSPCs. (F) Distribution of CHT residency times for n = 46 HSPCs from Runx1:cxcl8 transgenics and n = 62 HSPCs from control clutchmates. Vertical lines indicate the median for each group. Representative data from one of four similar experiments is shown. For cxcl8 vs. control: median of 2.67 vs. 1.5 h, p = 0.003, Wilcoxon rank-sum test. (G) Distribution of CHT residency times for Runx1:cxcl8 transgenics and control clutchmates in the prkcda(−/−) mutant background. n = 108 HSPCs for Runx1:cxcl8 and n = 111 HSPCs for control in 10 fish per group. (H) Distribution of CHT residency times for n = 110 HSPCs from Runx1:cxcl8 transgenics and n = 223 HSPCs from ΔELR-CXC clutchmates. Vertical lines indicate the median for each group. For cxcl8 vs. ΔELR-CXC; median of 4.66 vs. 2.66 h, p = 0.002, Wilcoxon rank-sum test. (I) Distribution of CHT residency times for n = 404 HSPCs for Runx1:cxcl8 and n = 174 HSPCs for competitor. Vertical lines indicated the median for each group. For cxcl8 vs. competitor: median of 2.75 vs. 1.75 h, p = 1 × 10⁻⁹, Wilcoxon rank-sum test. (J) Violin plots represent the percentage of time individual HSPCs were cuddled by endothelial cells within the CHT. n = 32 HSPCs for Runx1:cxcl8 and n = 108 HSPCs for control. For cxcl8 vs. control: median of 97.7% vs. 79.3% cuddling time, p = 0.0013, Wilcoxon rank-sum test. (K) Quantification of Runx1:EGFP+ HSPCs in Runx1:EGFP;Runx1:cxcl8-2A-mCherry transgenics (TG) and Runx1:EGFP clutchmates (−). Data are from one of two representative zebrafish clutches. Boxes represent mean ± SEM; each point is a biological replicate. For TG vs. −: 4.2 ± 0.27 vs. 2.1 ± 0.25 HSPCs per CHT, p = 5.5 × 10⁻⁷, Welch’s t test. (L) Quantification of Runx1:EGFP(+) HSPCs in Runx1:cxcl8-2A-mCherrytransgenics (TG) and cxcl8 transgene-negative control clutchmates (−) treated with the indicated drugs or vehicle control. Data are presented as fold change relative to control-treated, transgene-negative clutchmates and are pooled from eight independent experiments. Boxes represent mean ± SEM; each point is a biological replicate. For ibrutinib-treated cxcl8 transgene-negative zebrafish: 0.51 ± 0.08-fold relative to vehicle-treated clutchmates, p = 0.0067, Welch’s t test. (M) Quantitative RT-PCR for CXCL8 mRNA expression by THP-1 cells treated with ibrutinib or vehicle control. Four biological replicates were performed per condition; each point is the mean of three technical replicates. For ibrutinib-treated cells: 0.11 ± 0.08-fold decrease relative to vehicle control, p = 0.002, Welch’s t test. See also Figure S4.