
Fig. 4
- ID
- ZDB-IMAGE-231102-39
- Publication
- Binder et al., 2023 - Microenvironmental control of hematopoietic stem cell fate via CXCL8 and protein kinase C
- All Figures
- Figures for Binder et al., 2023
|
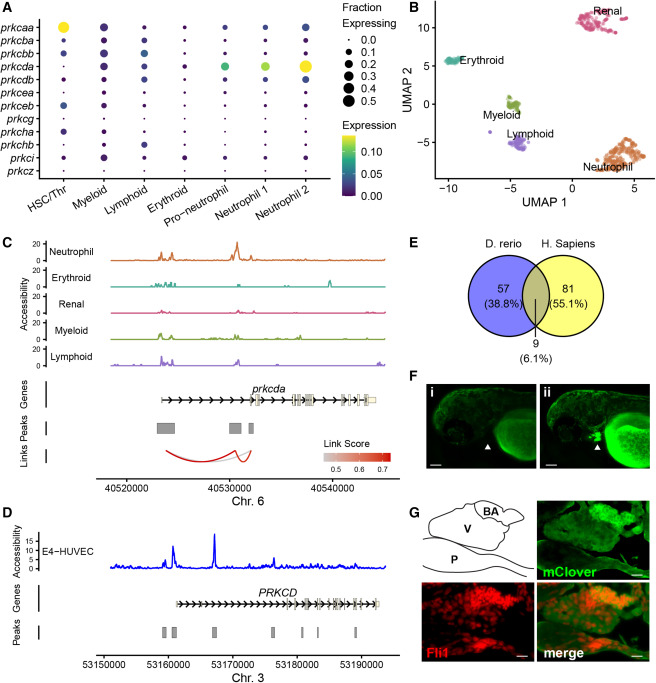
Fig. 4 Regulation of prkcda expression by an intronic enhancer element (A) Expression of PKC isoforms in kidney marrow cell clusters identified in Figure 3. (B) UMAP representation of global chromatin accessibility in single zebrafish kidney marrow cells. Samples are from the same kidney marrow pools shown in Figure 3. (C) Chromatin accessibility at the prkcda locus in kidney marrow cells by cluster. Peaks of chromatin accessibility and Cicero links identifying co-accessible peaks are shown. (D) Bulk ATAC sequencing showing chromatin accessibility at the human PRKCD locus in E4-HUVEC cells. Peaks were identified using MACS2. (E) FIMO analysis of zebrafish and human intron enhancer peak sequences. The number of putative binding sites with q < 0.05 in each set is indicated. (F) Expression of an mClover reporter construct driven by the zebrafish prkcda intronic enhancer in uninjected (i) and injected (ii) animals. Arrowhead indicates the bulbus arteriosus. Bar, 25 μm. (G) Immune fluorescence in a 72 hpf zebrafish embryo expressing the prkcda intronic enhancer reporter. Cryosections were probed with anti-GFP/mClover and anti-Fli1 antibodies and fluorescent secondaries (see STAR Methods). The outline indicates pericardium (P), ventricle (V), and bulbus arteriosus (BA, cardiac outflow tract). Bar, 10 μm. See also Figure S3 and Video S1.