
- Title
-
linc-mipep and linc-wrb encode micropeptides that regulate chromatin accessibility in vertebrate-specific neural cells
- Authors
- Tornini, V.A., Miao, L., Lee, H.J., Gerson, T., Dube, S.E., Schmidt, V., Kroll, F., Tang, Y., Du, K., Kuchroo, M., Vejnar, C.E., Bazzini, A.A., Krishnaswamy, S., Rihel, J., Giraldez, A.J.
- Source
- Full text @ Elife
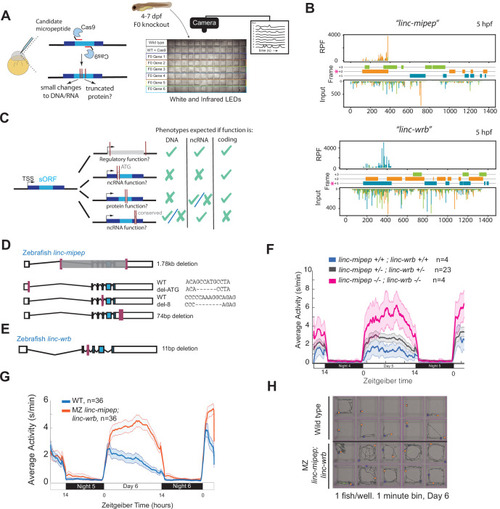
(A) Left, schematic of F0 CRISPR knockout behavioral screen. Zebrafish embryos were injected early at the one-cell embryo stage with multiple sgRNAs and Cas9 targeting the ORF of candidate micropeptides encoded within putative lincRNAs. Right, schematic of behavior screening platform. Each well of a 96-well flat bottom plate contains one zebrafish larva (4–7days post-fertilization, dpf) from the same wild type (WT) clutch. Individual locomotor activity was tracked at 25 frames per second on a 14hr:10hr light:dark cycle. (B) Ribosome footprint of linc-mipep (also known as lnc-rps25) (top) or linc-wrb (bottom) at 5hours post fertilization (hpf) across annotated transcript length, with putative coding frames in green (+3), orange (+2), or blue (+1); input (control) on bottom tracks. Magenta asterisk marks predicted short open reading frame. RPF, ribosome-protected fragment. (C) Summary of mutagenesis strategy to decode transcript functions. Magenta bars denote CRISPR-targeted area. Mutated/removed sequence is in gray. TSS, transcription start site. sORF, short open reading frame. ATG, start codon. ncRNA, non-coding RNA. Right, phenotypes predicted (check mark) or not predicted (x mark) for each mutant if the gene functions as a regulatory region, noncoding RNA, or protein-coding gene. (D) Stable mutants for linc-mipep: full region deletion (1.78kb deletion, from intron 1 – proximal 3’UTR, top); translation start site deletion that removes the ATG sequence (middle); frameshift deletion (8bp deletion at exon 4, second from bottom); 74bp deletion that removes highly conserved 3’UTR sequence (bottom). (E) Stable frameshift mutant for linc-wrb (11bp deletion, exon 3). (F) Locomotor activity of linc-mipepdel-1.8kb/del-1.8kb;linc-wrbdel-11/del-11 (linc-mipep -/-; linc-wrb -/-, magenta); linc-mipepdel-1.8kb/+;linc-wrbdel-11/+ (linc-mipep +/-; linc-wrb +/-, black); and wild-type (linc-mipep +/+; linc-wrb +/+, blue) sibling-matched larvae over 2 nights. (G) Locomotor activity of wild type (WT, blue) or maternal-zygotic linc-mipepdel1.8kb/del1.8kb;linc-wrbdel11bp/del11bp (linc-mipep;linc-wrb, orange) larvae across two nights. The ribbon represents± SEM. Zeitgeber time is defined from lights ON = 0. (H) Representative daytime locomotor activity tracking of wild type (top 2 rows) and maternal-zygotic linc-mipepdel1.8kb/del1.8kb;linc-wrbdel11bp/del11bp (linc-mipep;linc-wrb, bottom 2 rows) larvae during 1min at 6 dpf. Blue and orange dots represent start and stop locations, respectively.
|
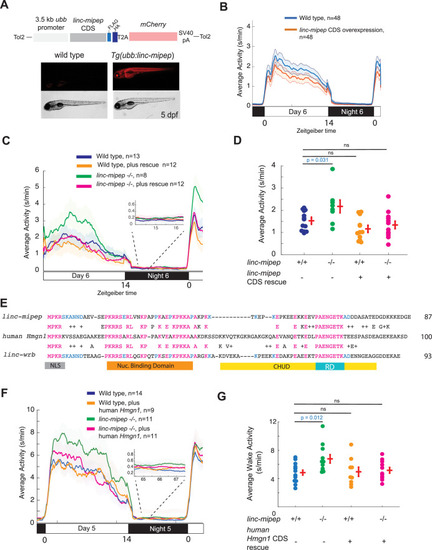
(A) Top, diagram of transgenic linc-mipep overexpression construct. Transgenic lines were established via Tol2-mediated integration of 3.5kb ubiquitin B (ubb) promotor driving the linc-mipep coding sequence with a FLAG and HA tag at the C-terminus, followed by a T2A self-cleaving peptide, mCherry reporter, and SV40 polyA tail. Bottom, fluorescent and brightfield images of 5 dpf zebrafish siblings either without overexpression (wild type, mCherry-negative, left) or with linc-mipep overexpression (mCherry-positive, right). (B) Activity plot of wild type (mCherry-negative, blue) or linc-mipep overexpression (Tg(ubb:linc-mipep) mCherry-positive, orange) siblings at 6 dpf. n=48 per genotype. Average day activity p=0.028, one-way ANOVA. (C) Locomotor activity of linc-mipep mutants, with or without transgenic linc-mipep overexpression (Tg(ubb:linc-mipep CDS-T2A-mCherry), ‘rescue’), sibling-matched larvae over 24hr. Inset, no effect on nighttime activity. (D) Average waking activity of 6 dpf linc-mipep mutant, heterozygous, or wild type larvae, with (denoted by +) or without (denoted by -) linc-mipep transgenic rescue. Each dot represents a single fish, and crossbars plot the mean ± SEM. p Values from a Dunnett’s test, using wild type (linc-mipep +/+) as the baseline condition. (E) Amino acid sequences of linc-mipep (top), linc-wrb (bottom), and human Hmgn1 (middle). Conserved amino acids are denoted in blue (if conserved between two sequences) or magenta (if conserved across the three sequences). Conserved functional domains for Hmgn1 are denoted (NLS, nuclear localization signal; Nuclear Binding Domain; RD, Regulatory Domain; and CHUD, Chromatin Unwinding Domain). (F) Locomotor activity of linc-mipep mutants, with or without transgenic human Hmgn1 overexpression (Tg(ubb:hHmgn1CDS-T2A-mCherry), ‘rescue’), sibling-matched larvae over 24hr. Inset, no effect on nighttime activity. (G) Average waking activity of 6 dpf linc-mipep mutant (-/-) or wild type (+/+) larvae, with (denoted by +) or without (denoted by -) human Hmgn1 transgenic rescue. Each dot represents a single larva, and crossbars plot the mean ± SEM. p Values from a Dunnett’s test, using wild type (linc-mipep +/+) as the baseline condition.
|
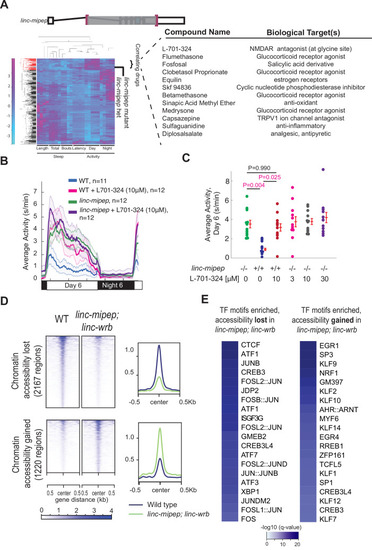
(A) Left, hierarchical clustering of the linc-mipep del-1.8kb (schematic of mutation at top) behavioral fingerprints (right), compared with the fingerprints of wild-type zebrafish larvae exposed to 550 psychoactive agents from 4 to 6 dpf (Rihel et al., 2010). The Z score, defined as the average value (in standard deviations) relative to the behavioral profiles of WT exposed to DMSO, is represented by each rectangle in the clustergram (magenta, higher than DMSO; cyan, lower than DMSO). The linc-mipep del-1.8kb fingerprint correlates with agents that induce daytime activity (‘‘Correlating Drugs’’). Right, compounds ranked according to correlation with the linc-mipep del-1.8kb fingerprint, with biological target(s) noted in last column. (B) Locomotor average activity of wild-type larvae treated with DMSO (WT, blue) or with 10μM NMDA receptor antagonist L-701,324 (magenta), and linc-mipep del-1.8kb/del-1.8kb larvae treated with DMSO (linc-mipep, green) or with 10μM L-701,324 (purple); sibling-matched larvae tracked over 24hr. (C) Average activity (day 6) of WT larvae treated with DMSO or 10μM L-701-324, compared to linc-mipepdel-1.8kb/del-1.8kb larvae treated with DMSO or 3μM, 10μM, or 30μM L-701-324. Each dot represents one fish. L-701–324 has a strong effect in the wild type animals but not in the mutants (P=0.05, DrugXGenotype interaction, two-way ANOVA). Key p-values are shown based on Tukey’s post-hoc testing. (D) Heatmaps (left) and density plots (right) showing chromatin accessibility (omni-ATAC-seq, average of three replicates) profiles of 2167 regions globally with lower accessibility in linc-mipep; linc-wrb mutant brains at 5 dpf compared to wild type (WT) brains (top), or 1220 regions globally with higher accessibility in linc-mipep; linc-wrb mutant brains at 5 dpf compared to wild type (WT) brains. Heatmaps are centered at the summit of the Omni-ATAC peak with 500bp on both sides and ranked according to global accessibility levels in WT. (E) Transcription factor (TF) motifs enriched in up-regulated and down-regulated regions (in D), relative to unaffected regions (in Figure 3—figure supplement 3).
|
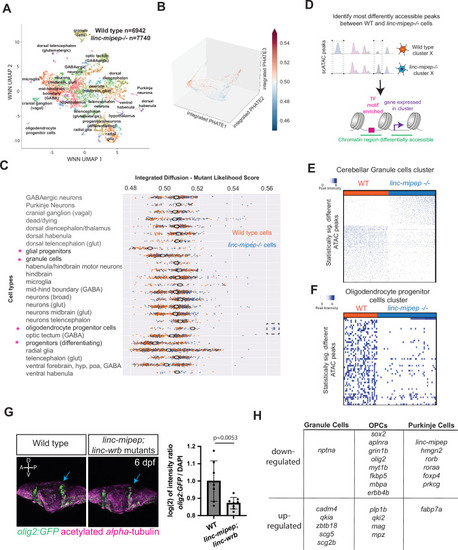
(A) UMAP representation of WNN analyses of wild type (n=6,942 nuclei) and linc-mipep del-1.8kb/del-1.8kb (n=7740 nuclei) mutant brains at 6 dpf. Identified cell types as labeled. (B) PHATE plot of integrated diffusion analysis of 6 dpf linc-mipep del-1.8kb/del-1.8kb mutant or WT sibling brain nuclei, color-coded by mutant likelihood score as computed by MELD using Integrated Diffusion operator. (C) Integrated diffusion analysis on identified cell types from 6 dpf wild type (orange) and linc-mipep del-1.8kb/del-1.8kb (blue) brains. Each dot represents a single cell, with mutant likelihood score across X-axis. Most wild type- or mutant-like groups noted with an asterisk. Cell types are clustered by known marker genes as defined in Supplementary file 6. (D) Schematic of analysis to identify most differentially accessible peaks between WT and linc-mipep del-1.8kb/del-1.8kb mutant brain nuclei from merged Weighted Nearest Neighbors (WNN) clusters. The most statistically significant changes in chromatin accessibility peaks were identified by the Wilcoxon rank sum and the Kolmogorov-Smirnov (KS) one-tailed tests methods on intensity distributions of each peak in WT and mutant samples, for either wild type or mutant differentially expressed genes per cluster, and for transcription factor (TF) motif overrepresentation by genotype in each cluster.(E) Statistically significantly different chromatin accessibility peaks between 6 dpf wild type (WT, blue) and linc-mipep del-1.8kb/del-1.8kb mutant (red) nuclei in the cerebellar granule cells cluster. Each column is one nucleus. Color scale, peak intensity (blue, more accessible). (F) Statistically significantly different chromatin accessibility peaks between 6 dpf wild type (WT, blue) and linc-mipep del-1.8kb/del-1.8kb mutant (red) nuclei in the oligodendrocyte progenitor cells (OPCs) cluster. Color scale, peak intensity (blue, more accessible). (G) Left, lateral view confocal images (Z-stack) from Tg(olig2:GFP) brains in wild type (left) or linc-mipep; linc-wrb double mutant (right) backgrounds at 6 dpf, stained with GFP (olig2+, green) and acetylated alpha-tubulin (magenta). A, anterior; P, posterior; D, dorsal; V, ventral. Right, quantification of intensity ratio of GFP+/DAPI signal of whole brain normalized to WT. One-tailed t-test, P=0.0053. (H) Select differentially regulated genes, down- or up-regulated per each cerebellar granule cells, OPCs, or Purkinje cells cluster. Full list of genes is presented in Supplementary file 5.
|