
Figure 4
- ID
- ZDB-FIG-230518-30
- Publication
- Tornini et al., 2023 - linc-mipep and linc-wrb encode micropeptides that regulate chromatin accessibility in vertebrate-specific neural cells
- Other Figures
- All Figure Page
- Back to All Figure Page
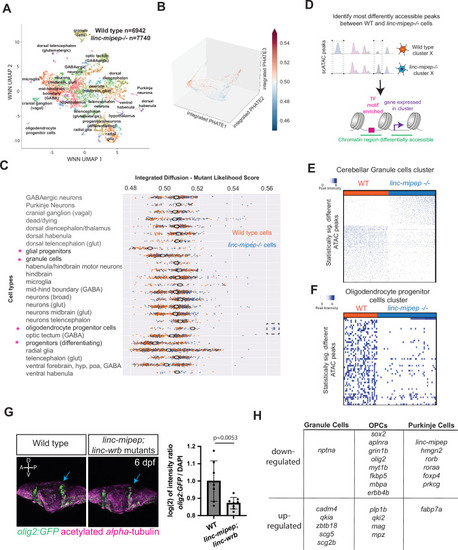
(A) UMAP representation of WNN analyses of wild type (n=6,942 nuclei) and linc-mipep del-1.8kb/del-1.8kb (n=7740 nuclei) mutant brains at 6 dpf. Identified cell types as labeled. (B) PHATE plot of integrated diffusion analysis of 6 dpf linc-mipep del-1.8kb/del-1.8kb mutant or WT sibling brain nuclei, color-coded by mutant likelihood score as computed by MELD using Integrated Diffusion operator. (C) Integrated diffusion analysis on identified cell types from 6 dpf wild type (orange) and linc-mipep del-1.8kb/del-1.8kb (blue) brains. Each dot represents a single cell, with mutant likelihood score across X-axis. Most wild type- or mutant-like groups noted with an asterisk. Cell types are clustered by known marker genes as defined in Supplementary file 6. (D) Schematic of analysis to identify most differentially accessible peaks between WT and linc-mipep del-1.8kb/del-1.8kb mutant brain nuclei from merged Weighted Nearest Neighbors (WNN) clusters. The most statistically significant changes in chromatin accessibility peaks were identified by the Wilcoxon rank sum and the Kolmogorov-Smirnov (KS) one-tailed tests methods on intensity distributions of each peak in WT and mutant samples, for either wild type or mutant differentially expressed genes per cluster, and for transcription factor (TF) motif overrepresentation by genotype in each cluster.(E) Statistically significantly different chromatin accessibility peaks between 6 dpf wild type (WT, blue) and linc-mipep del-1.8kb/del-1.8kb mutant (red) nuclei in the cerebellar granule cells cluster. Each column is one nucleus. Color scale, peak intensity (blue, more accessible). (F) Statistically significantly different chromatin accessibility peaks between 6 dpf wild type (WT, blue) and linc-mipep del-1.8kb/del-1.8kb mutant (red) nuclei in the oligodendrocyte progenitor cells (OPCs) cluster. Color scale, peak intensity (blue, more accessible). (G) Left, lateral view confocal images (Z-stack) from Tg(olig2:GFP) brains in wild type (left) or linc-mipep; linc-wrb double mutant (right) backgrounds at 6 dpf, stained with GFP (olig2+, green) and acetylated alpha-tubulin (magenta). A, anterior; P, posterior; D, dorsal; V, ventral. Right, quantification of intensity ratio of GFP+/DAPI signal of whole brain normalized to WT. One-tailed t-test, P=0.0053. (H) Select differentially regulated genes, down- or up-regulated per each cerebellar granule cells, OPCs, or Purkinje cells cluster. Full list of genes is presented in Supplementary file 5.
|