
- Title
-
An automated microscopy workflow to study Shigella-neutrophil interactions and antibiotic efficacy in vivo
- Authors
- Lensen, A., Gomes, M.C., López-Jiménez, A.T., Mostowy, S.
- Source
- Full text @ Dis. Model. Mech.
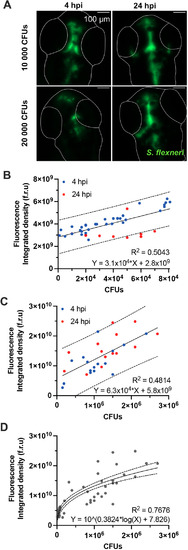
Quantification of bacterial burden in the HBVs. Data presented here were collected in the HBVs of S. flexneri M90T-infected 2 dpf zebrafish larvae. (A) Representative images of infected larvae injected with 10,000 or 20,000 CFUs at 4 or 24 hpi. Images are sum slice z-projections. Scale bars: 100 µm. S. flexneri M90T is shown in green. Outlines of larvae HBVs are shown in white. Plotted in B-D is the total fluorescence in the z-stack image of S. flexneri M90T-infected zebrafish larvae HBVs, at different infectious doses, measured at 4 (blue dots) or 24 hpi (red dots), and correlated to the precise number of CFUs (experimentally assessed). (B) Correlation between total fluorescence and precise number of CFUs in larvae with low bacterial burden (n=45). (C) Correlation between total fluorescence and precise number of CFUs in larvae with high bacterial burden (n=45). (D) Correlation between total fluorescence and precise number of CFUs in larvae with low or high bacterial burden (n=90). Solid lines indicate linear (B,C) or log (D) regressions. Dashed lines indicate 95% confidence intervals. |
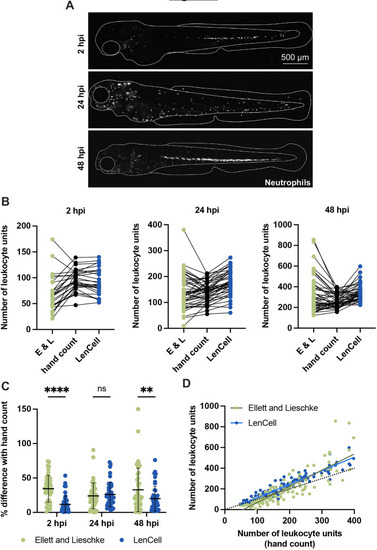
Quantification of zebrafish neutrophils. All data presented here were collected from S. flexneri M90T-infected 2 dpf zebrafish larvae (2500 CFUs) at 2, 24 and 48 hpi, or from PBS-injected larvae. (A) Representative images of infected Tg(lyz::DsRed)nz50 larvae. Assessment of neutrophil numbers in larvae at 48 hpi during emergency granulopoiesis is particularly challenging. Neutrophils are shown in white. Scale bar: 500 µm. (B) Comparison of leukocyte units/neutrophil numbers counted by hand (black), using the Ellett and Lieschke (E&L) method (green) or the LenCell macro (blue) in infected larvae at 2, 24 and 48 hpi. Leukocyte unit quantifications are provided. Data are presented without post-processing correction; n=44 per method. (C) Leukocyte unit quantification in infected larvae at 2, 24 and 48 hpi. Comparison between hand count of leukocyte units/neutrophils, and that using the Ellett and Lieschke method (green) or the LenCell macro (blue). Plotted values are the differences in percentage between the count using the macro and by hand for every sample (n=44 per method). **P<0.01; ****P<0.0001; ns, not significant. Two-way ANOVA with Sidak's multiple comparison test. Black bars: mean±s.e.m. (D) Correlation of leucocyte units between hand count (x-axis), and use of the Ellet and Lieschke method count (green) and the LenCell macro (blue) (both y-axis); n=132 per method. Black dotted line indicates the identity line. Green line indicates the linear regression on the Ellett and Lieschke method results (slope=1.561). Blue line indicates the linear regression of the LenCell macro results (slope=1.312). |
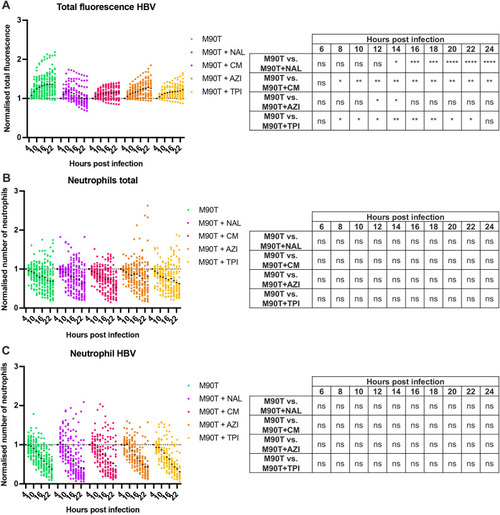
Impact of antibiotics on bacteria and neutrophils during infection. All data presented here were collected from S. flexneri M90T-infected 2 dpf zebrafish larvae that had either not been treated (green), or had been treated with nalidixic acid (NAL, purple), chloramphenicol (CM, pink), azithromycin (AZI, orange) or trimethoprim (TPI, yellow). (A) Normalised total bacterial fluorescence in HBVs. Data were normalized to the first timepoint (4 hpi) and pooled from three independent experiments using n>10 larvae per condition per experiment. ns, non-significant; *P<0.05; **P<0.01; ***P<0.001; ****P<0.0001. Two-way ANOVA with Dunnett's multiple comparisons test. (B) Normalised neutrophil quantification at whole larvae level. Data were normalized to the first timepoint (4 hpi) and pooled from three independent experiments using n>10 larvae per condition per experiment. ns, non-significant. Two-way ANOVA with Dunnett's multiple comparisons test. (C) Normalised neutrophil quantification in HBVs. Data were normalized to the first timepoint (4 hpi) and pooled from three independent experiments using n>10 larvae per condition per experiment. ns, non-significant. Two-way ANOVA with Dunnett's multiple comparisons test. |
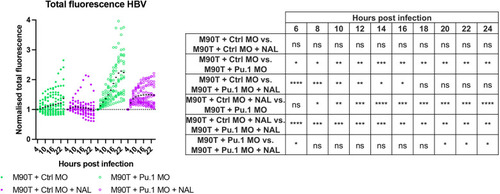
Nalidixic acid and leukocytes work in an additive manner to control S. flexneri infection. All data presented here were collected from control-injected (Ctrl MO, full circles) and pu.1 morpholino-injected larvae (Pu.1 MO, open circles). S. flexneri M90T-infected 2 dpf zebrafish larvae were either not treated (green) or treated with nalidixic acid (NAL, purple). Pooled data are from three independent experiments (n>3 larvae per condition per experiment). ns, non-significant; *P<0.05, **P<0.01, ***P<0.001, ****P<0.0001. Two-way ANOVA with Tukey's multiple comparisons test. |
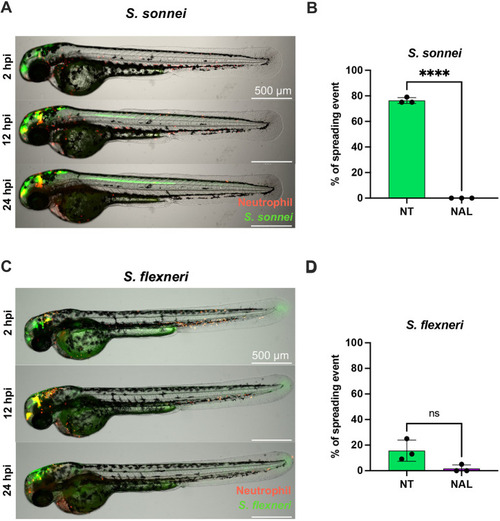
Nalidixic acid prevents Shigella dissemination in zebrafish larvae. All data presented here were collected from S. sonnei 53G- or S. flexneri M90T-infected 2 dpf zebrafish larvae that had either been not treated (NT, green) or had been treated with nalidixic acid (NAL, purple). (A) Representative spreading event in a larva infected with S. sonnei 53G GFP (green), with neutrophils labelled in red. The same larva was imaged at 2, 12 and 24 hpi, while being embedded in low melting agarose for the duration of the experiment. The green line through the larval spine indicates the spreading event. Scale bars: 500 µm. (B) Percentage of spreading events in larvae infected with S. sonnei 53G over the course of 24 hpi. Data were pooled from three independent experiments, with n>10 larvae per condition per experiment. ****P<0.0001. Unpaired two-tailed Student's t-test. (C) Representative spreading event in a larva infected with S. flexneri M90T GFP (green), with neutrophils labelled in red. The same larva was imaged at 2, 12 and 24 hpi, while being embedded in low melting agarose for the duration of the experiment. The green line through the larval spine indicates the spreading event. Scale bars: 500 µm. (D) Percentage of spreading events in larvae infected with S. flexneri M90T over the course of 24 hpi. Data were pooled from three independent experiments, with n>10 larvae per condition per experiment. ns, non-significant. Unpaired two-tailed Student's t-test. |