
|
Fig. 1.
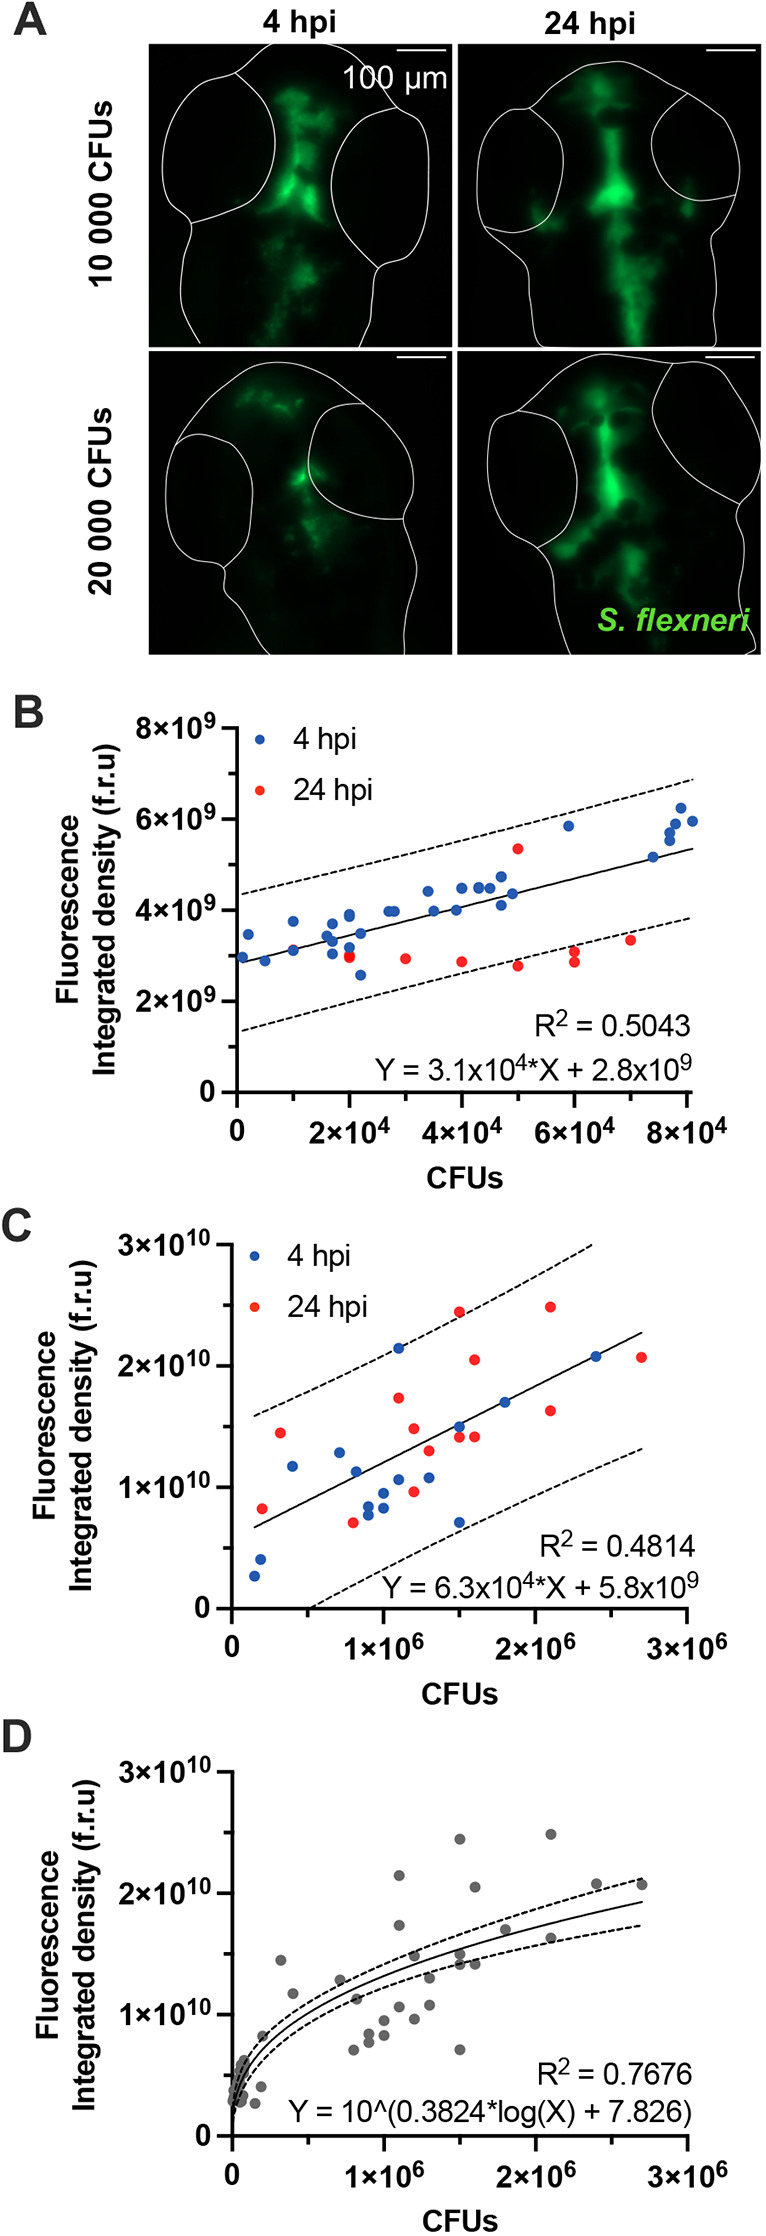
Quantification of bacterial burden in the HBVs. Data presented here were collected in the HBVs of S. flexneri M90T-infected 2 dpf zebrafish larvae. (A) Representative images of infected larvae injected with 10,000 or 20,000 CFUs at 4 or 24 hpi. Images are sum slice z-projections. Scale bars: 100 µm. S. flexneri M90T is shown in green. Outlines of larvae HBVs are shown in white. Plotted in B-D is the total fluorescence in the z-stack image of S. flexneri M90T-infected zebrafish larvae HBVs, at different infectious doses, measured at 4 (blue dots) or 24 hpi (red dots), and correlated to the precise number of CFUs (experimentally assessed). (B) Correlation between total fluorescence and precise number of CFUs in larvae with low bacterial burden (n=45). (C) Correlation between total fluorescence and precise number of CFUs in larvae with high bacterial burden (n=45). (D) Correlation between total fluorescence and precise number of CFUs in larvae with low or high bacterial burden (n=90). Solid lines indicate linear (B,C) or log (D) regressions. Dashed lines indicate 95% confidence intervals.