
|
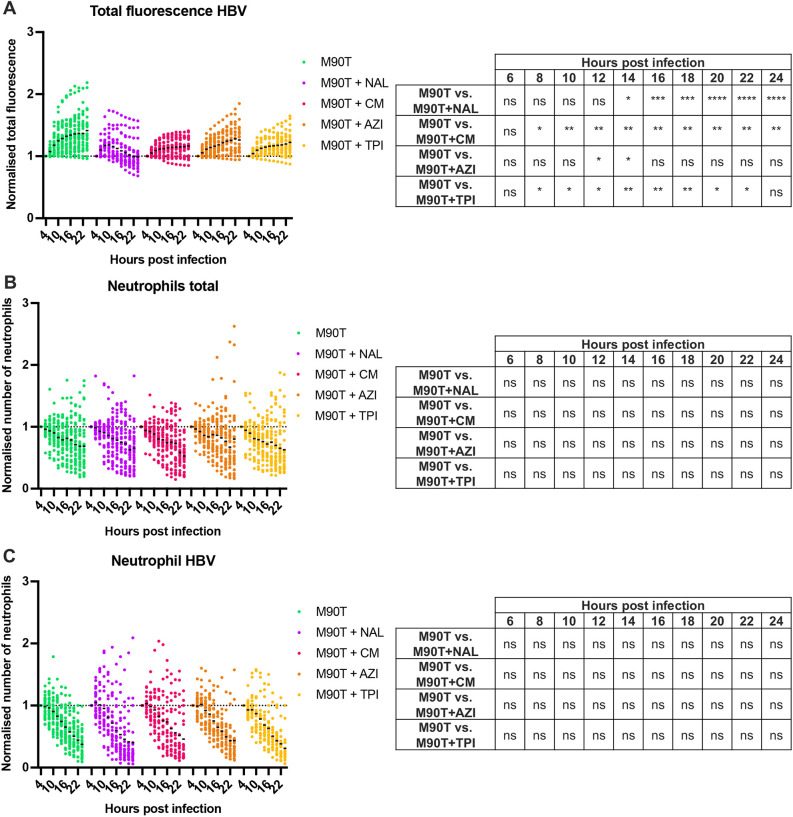
Fig. 3.
Impact of antibiotics on bacteria and neutrophils during infection. All data presented here were collected from S. flexneri M90T-infected 2 dpf zebrafish larvae that had either not been treated (green), or had been treated with nalidixic acid (NAL, purple), chloramphenicol (CM, pink), azithromycin (AZI, orange) or trimethoprim (TPI, yellow). (A) Normalised total bacterial fluorescence in HBVs. Data were normalized to the first timepoint (4 hpi) and pooled from three independent experiments using n>10 larvae per condition per experiment. ns, non-significant; *P<0.05; **P<0.01; ***P<0.001; ****P<0.0001. Two-way ANOVA with Dunnett's multiple comparisons test. (B) Normalised neutrophil quantification at whole larvae level. Data were normalized to the first timepoint (4 hpi) and pooled from three independent experiments using n>10 larvae per condition per experiment. ns, non-significant. Two-way ANOVA with Dunnett's multiple comparisons test. (C) Normalised neutrophil quantification in HBVs. Data were normalized to the first timepoint (4 hpi) and pooled from three independent experiments using n>10 larvae per condition per experiment. ns, non-significant. Two-way ANOVA with Dunnett's multiple comparisons test.