
- Title
-
Antioxidant Carboxymethyl Chitosan Carbon Dots with Calcium Doping Achieve Ultra-Low Calcium Concentration for Iron-Induced Osteoporosis Treatment by Effectively Enhancing Calcium Bioavailability in Zebrafish
- Authors
- Yu, L., Li, X., He, M., Wang, Q., Chen, C., Li, F., Li, B., Li, L.
- Source
- Full text @ Antioxidants (Basel)
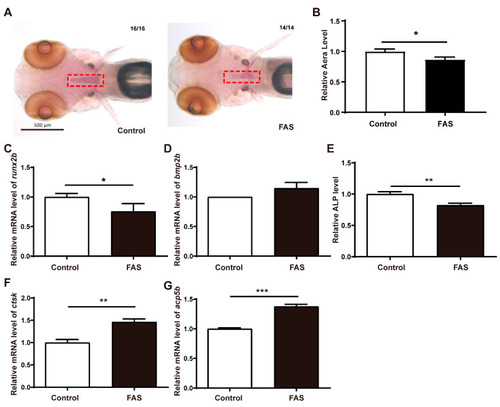
Establishment of iron overload osteoporosis model. (A). Alizarin red staining, The red rectangle is the location of osteoporosis. (B). Numerical analysis of staining area (unit: pixel), Effect of FAS on genes osteoblast-regulated genes, (C). runx2b, (D). bmp2b, (E). The content of ALP, Effect of FAS on osteoclast-regulated genes, (F). ctsk, (G). acp5b, (n = 3, t-test, * p < 0.05, ** p < 0.01, *** p < 0.001). |
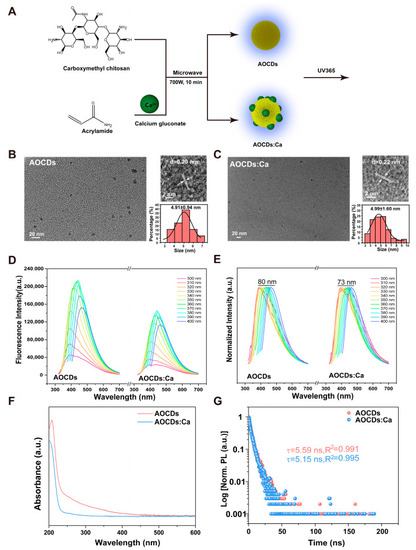
Particle size and luminescence characteristics of CDs. (A). The synthetic route of AOCDs and AOCDs:Ca, (B). AOCDs particle size and (C). AOCDs:Ca particle size detection by TEM, The lines mark the adjacent diffraction peaks and indicate them with arrows (D). AOCDs and Ca @ AOCDs fluorescence emission spectra, (E). AOCDs and AOCDs:Ca wavelength redshift, (F). UV absorption spectra, (G). Fluorescence lifetime. |
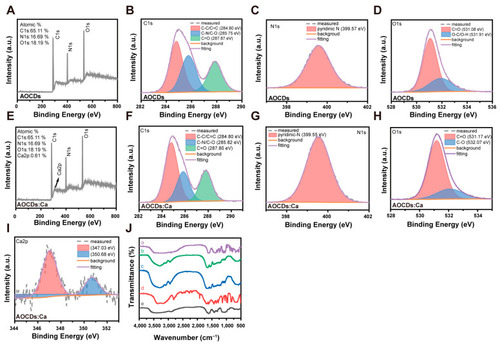
Structural analysis of CDs. XPS analyzed the structure of AOCDs (A). Element content; (B). C1s spectra; (C). N1s spectra; (D). O1s spectra, XPS analyzed the structure of AOCDs:Ca; (E). Element content; (F). C1s spectra; (G). N1s spectra; (H). O1s spectra; (I). Ca2 p spectra; (J). Comparison of raw materials and CDs structure by FT-IR. a: Calcium gluconate; b: AOCDs:Ca; c: AOCDs; d:Acryamide; e: Carboxymethyl chitosan. |
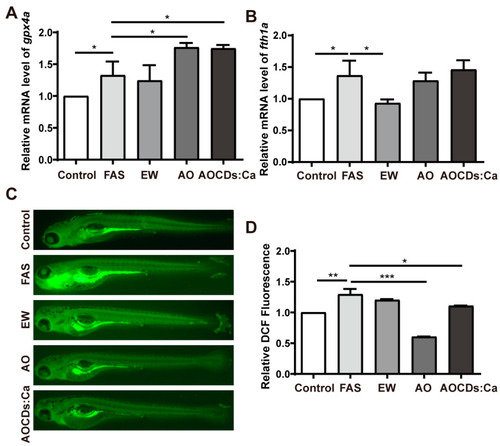
Antioxidant properties of AOCDs and AOCDs:Ca. (A). Relative expression level of gpx4a, (B). Relative expression level of fth1a, (C). Qualitative detection of ROS level, (D). Relative quantitative analysis of ROS content (n = 3, t-test, * p < 0.05, ** p < 0.01, *** p < 0.001). |
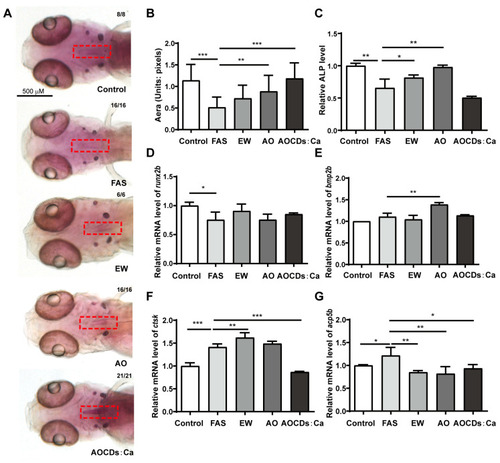
AOCDs:Ca treated iron overload osteoporosis by calcium supplementation. (A). Alizarin red staining., The red rectangle is the location of osteoporosis. (B). Numerical analysis of staining area (unit: pixel), (C). The content of ALP, Effect of treatment on genes osteoblast-regulated genes (D). runx2b, (E). bmp2b, (F). ctsk, (G). acp5b, (t-test, * p < 0.05, ** p < 0.01, *** p < 0.001). |
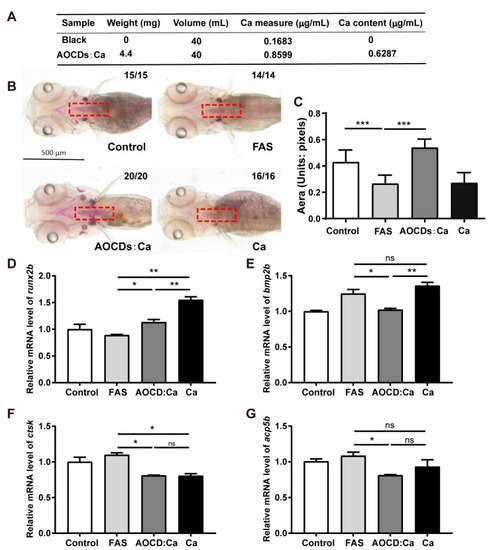
The effect of AOCDs:Ca superior to calcium in iron overload OP. (A). The measure of calcium content in AOCDs:Ca, (B). Alizarin red staining, (C). Numerical analysis of staining area (unit: pixel), (n = 3, t-test, *** p < 0.001). Effect of treatment on genes osteoblast-regulated genes, (D). runx2b, (E). bmp2b, (F). ctsk, (G). acp5b, (t-test, * p < 0.05, ** p < 0.01, *** p < 0.001). |