
Image
|
Figure Caption
Figure 3
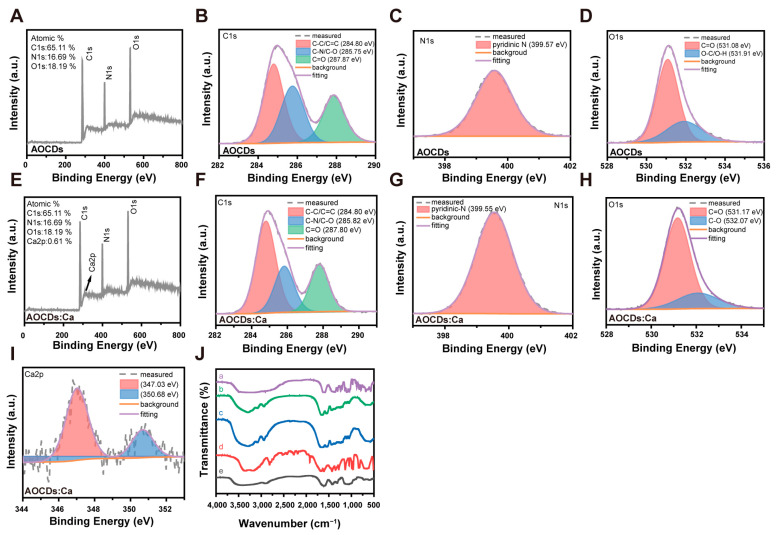
Structural analysis of CDs. XPS analyzed the structure of AOCDs (A). Element content; (B). C1s spectra; (C). N1s spectra; (D). O1s spectra, XPS analyzed the structure of AOCDs:Ca; (E). Element content; (F). C1s spectra; (G). N1s spectra; (H). O1s spectra; (I). Ca2 p spectra; (J). Comparison of raw materials and CDs structure by FT-IR. a: Calcium gluconate; b: AOCDs:Ca; c: AOCDs; d:Acryamide; e: Carboxymethyl chitosan.
Acknowledgments
This image is the copyrighted work of the attributed author or publisher, and
ZFIN has permission only to display this image to its users.
Additional permissions should be obtained from the applicable author or publisher of the image.
Full text @ Antioxidants (Basel)