
Image
|
Figure Caption
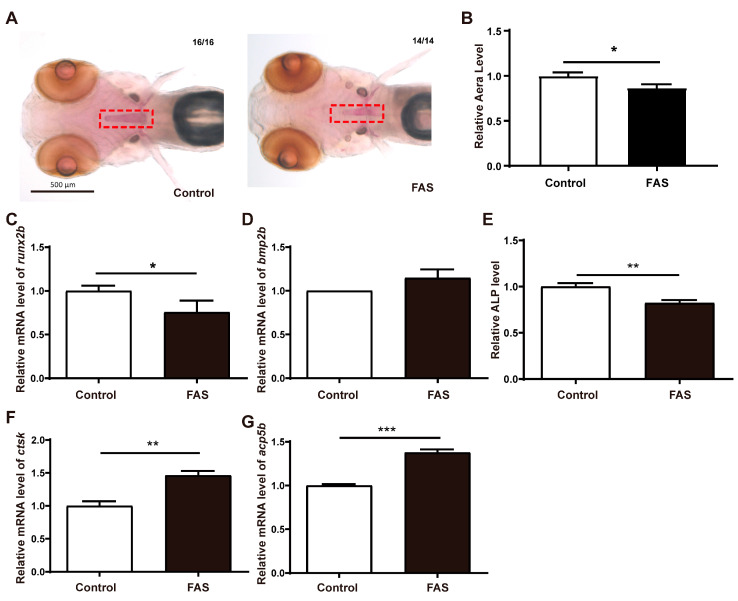
Figure 1
Establishment of iron overload osteoporosis model. (A). Alizarin red staining, The red rectangle is the location of osteoporosis. (B). Numerical analysis of staining area (unit: pixel), Effect of FAS on genes osteoblast-regulated genes, (C). runx2b, (D). bmp2b, (E). The content of ALP, Effect of FAS on osteoclast-regulated genes, (F). ctsk, (G). acp5b, (n = 3, t-test, * p < 0.05, ** p < 0.01, *** p < 0.001).
Acknowledgments
This image is the copyrighted work of the attributed author or publisher, and
ZFIN has permission only to display this image to its users.
Additional permissions should be obtained from the applicable author or publisher of the image.
Full text @ Antioxidants (Basel)