
Image
|
Figure Caption
Figure 6
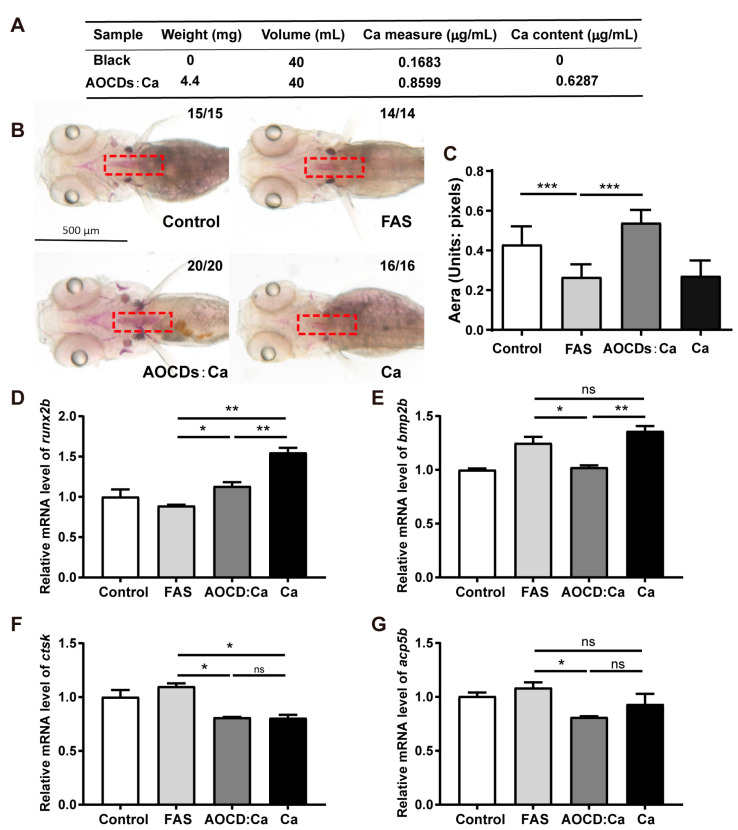
The effect of AOCDs:Ca superior to calcium in iron overload OP. (A). The measure of calcium content in AOCDs:Ca, (B). Alizarin red staining, (C). Numerical analysis of staining area (unit: pixel), (n = 3, t-test, *** p < 0.001). Effect of treatment on genes osteoblast-regulated genes, (D). runx2b, (E). bmp2b, (F). ctsk, (G). acp5b, (t-test, * p < 0.05, ** p < 0.01, *** p < 0.001).
Acknowledgments
This image is the copyrighted work of the attributed author or publisher, and
ZFIN has permission only to display this image to its users.
Additional permissions should be obtained from the applicable author or publisher of the image.
Full text @ Antioxidants (Basel)