
- Title
-
Isopropyl 3-(3,4-dihydroxyphenyl)-2-hydroxypropanoate plays an anti-hypoxic role through regulating neuroactive ligand-receptor interaction signaling pathway in larval zebrafish
- Authors
- Zhang, S., Wang, X., Yang, Q., Xia, Q., Zhao, Y., Zheng, X., Zhang, Y., Liu, K.
- Source
- Full text @ Biomed. Pharmacother.
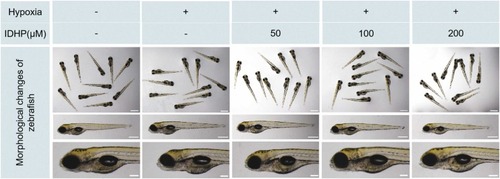
Phenotypes of hypoxia treated and Isopropyl 3-(3,4-dihydroxyphenyl)− 2-hydroxypropanoate (IDHP, 50–200 μM) intoxicated zebrafish larvae. |
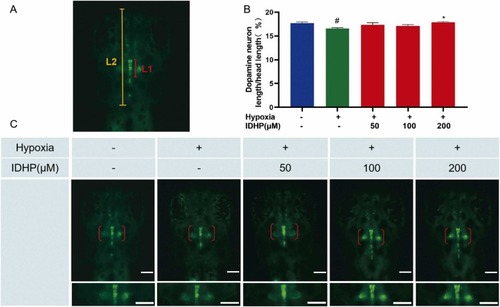
IDHP protected the development of dopaminergic neurons (DANs) from hypoxia. (A) The schematic picture of dopaminergic neurons (DANs) (L1) and head (L2) measurement. (B) Statistical analysis of the ratio of L1/L2. The scale bar is 100 µm. n = 8. (C) Typical fluorescent images of DAN in Tg(vmat2:GFP) zebrafish larvae. Dopaminergic neuron (DAN)-rich region was delineated with red brackets. #P < 0.05, vs control group; *P < 0.05, vs hypoxia-treated group. |
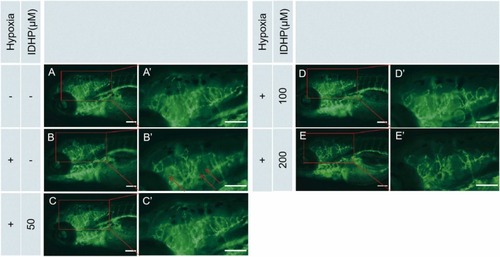
IDHP ameliorated hypoxia-induced cerebral vascular injury. (A-E) Typical fluorescent images of cerebral blood vessels in Tg(VEGFR2:GFP) fish larvae. The scale bar is 100 µm. (A’-E’) Amplification of A-E in red box. Decreased blood vessels were denoted with red arrowhead. |
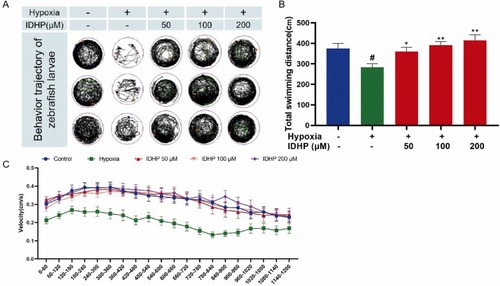
IDHP ameliorated hypoxia-induced abnormal locomotor activity. (A) Behavior tracking of zebrafish larvae within 20 min. Black-, green- and red-lines indicate slow-, medium- and high-speed motion trajectory respectively. (B) Total movement distance of zebrafish larvae, n = 25. (C) Average movement speed of larvae for different periods. |
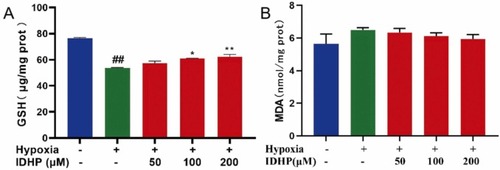
IDHP ameliorated hypoxia-induced oxidative stress. Qualification of the level of glutathione (GSH) (A) and malondialdehyde (MDA) (B). ##P < 0.01, vs control group; *P < 0.05, vs hypoxia-treated group; * *P < 0.01, vs hypoxia-treated group. |
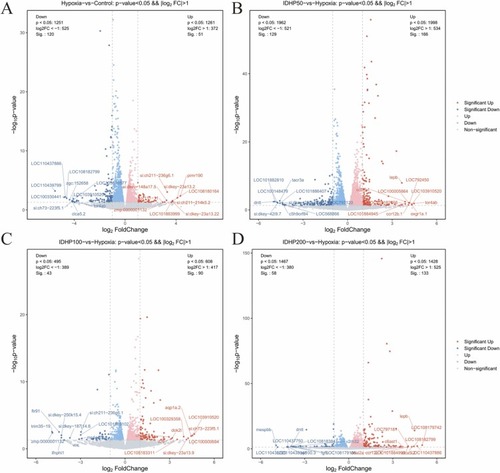
Volcano plots of differentially expressed genes (DEGs). (A) DEGs in hypoxia-induced fish larvae as compared to control ones. (B-D) DEGs in IDHP-administrated fish larvae as compared to hypoxia-induced ones at concentrations of 50 μM, 100 μM and 200 μM IDHP. Red, blue, and gray dots indicate upregulated, downregulated and no-significant-change genes respectively. |
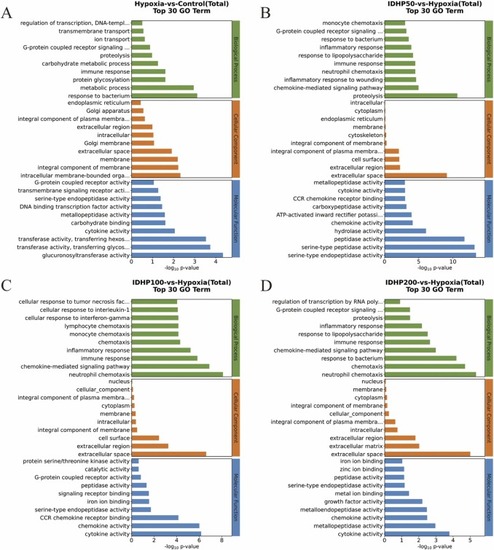
Gene Ontology (GO) functional enrichment analysis of DEGs. (A) GO analysis of DEGs of hypoxia-induced larval zebrafish. (B-D) GO analysis of DEGs of IDHP-administrated larval zebrafish at the concentrations of 50 μM, 100 μM and 200 μM IDHP. Green, orange, and blue diagrams showing biological processes (BP), cellular components (CC) and molecular functions (MF). |
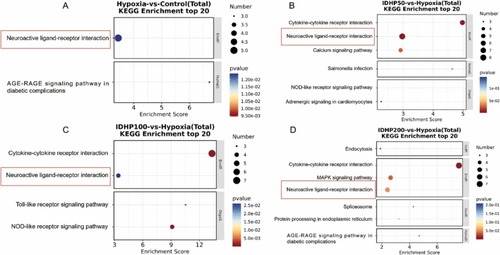
KEGG pathway enrichment analysis of DEGs. (A) KEGG enrichment diagram of DEGs in hypoxia-induced larval zebrafish. (B-D) KEGG enrichment diagram of DEGs of IDHP-administrated larval zebrafish at the concentrations of 50 μM, 100 μM and 200 μM IDHP. The commonly involved pathway was delineated with red box. |
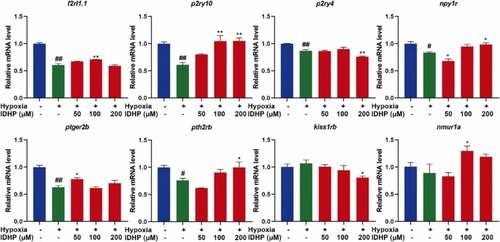
Effects of IDHP on hypoxia-induced injury in RNA level. ##P < 0.01, #P < 0.01 vs control group; * *P < 0.01, *P < 0.05 vs hypoxia-treated group. |
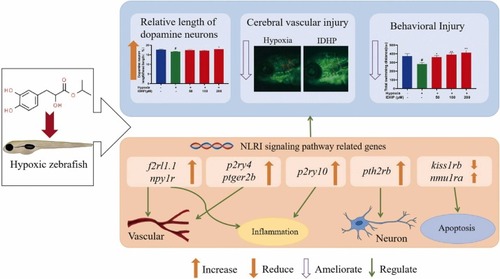
Speculated molecular mechanisms in the treatment of hypoxia-induced injury by IDHP. |