
Image
|
Figure Caption
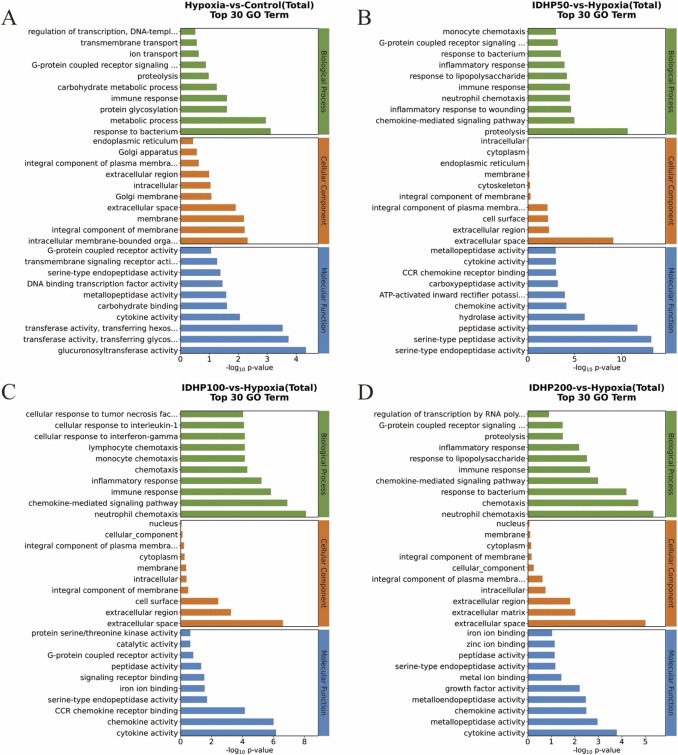
Fig. 7 Gene Ontology (GO) functional enrichment analysis of DEGs. (A) GO analysis of DEGs of hypoxia-induced larval zebrafish. (B-D) GO analysis of DEGs of IDHP-administrated larval zebrafish at the concentrations of 50 μM, 100 μM and 200 μM IDHP. Green, orange, and blue diagrams showing biological processes (BP), cellular components (CC) and molecular functions (MF).
Acknowledgments
This image is the copyrighted work of the attributed author or publisher, and
ZFIN has permission only to display this image to its users.
Additional permissions should be obtained from the applicable author or publisher of the image.
Full text @ Biomed. Pharmacother.