
Image
|
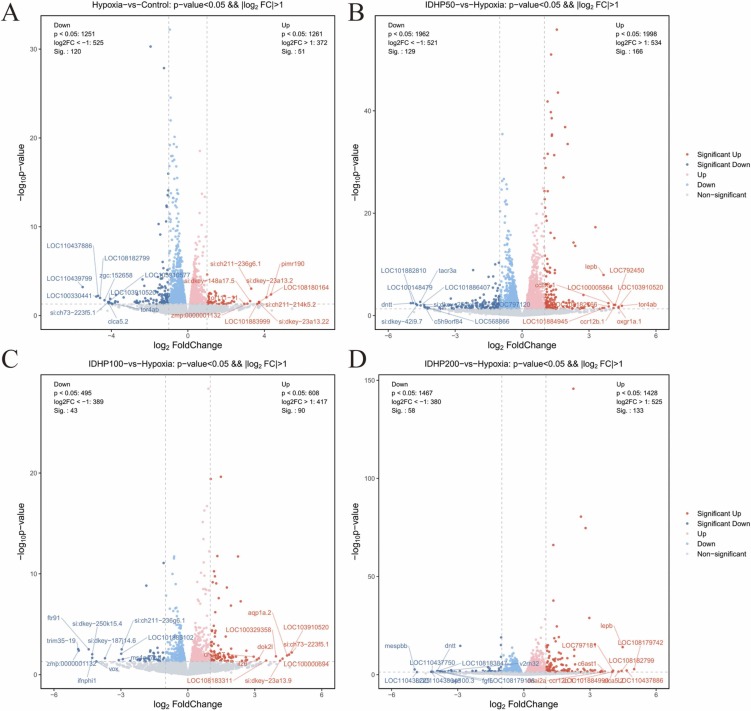
Figure Caption
Fig. 6 Volcano plots of differentially expressed genes (DEGs). (A) DEGs in hypoxia-induced fish larvae as compared to control ones. (B-D) DEGs in IDHP-administrated fish larvae as compared to hypoxia-induced ones at concentrations of 50 μM, 100 μM and 200 μM IDHP. Red, blue, and gray dots indicate upregulated, downregulated and no-significant-change genes respectively.
Acknowledgments
This image is the copyrighted work of the attributed author or publisher, and
ZFIN has permission only to display this image to its users.
Additional permissions should be obtained from the applicable author or publisher of the image.
Full text @ Biomed. Pharmacother.