
- Title
-
Taurocholic Acid and Glycocholic Acid Inhibit Inflammation and Activate Farnesoid X Receptor Expression in LPS-Stimulated Zebrafish and Macrophages
- Authors
- Ge, X., Huang, S., Ren, C., Zhao, L.
- Source
- Full text @ Molecules
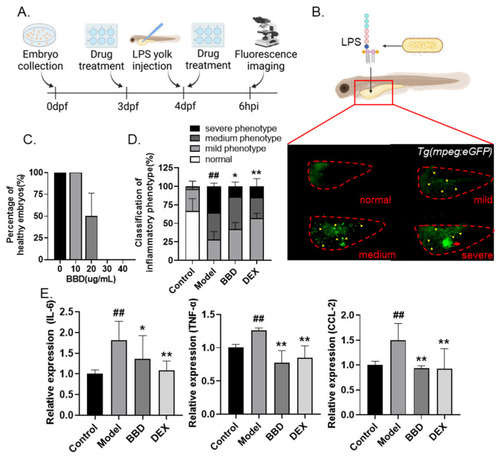
Anti-inflammatory effects of BBD on LPS-induced zebrafish inflammation model. (A) Flow chart of LPS-induced inflammation modeling. (B) Representative photos of zebrafish larvae of different degrees of inflammation. Embryos were classified as normal (no macrophage aggregation), mild (≤30 macrophages in yolk), medium (>30 macrophages but without an aggregation cluster), or severe (>30 macrophages and with an aggregation cluster). The red dotted line indicates zebrafish yolks, the yellow arrows indicate macrophages, and the red arrow indicates the aggregation cluster. (C) Toxicity of BBD treatment (n = 10). Larvae with cardiac edema, or body distortion, are defined as unhealthy. (D) The classification of inflammatory phenotypes in zebrafish embryos of different groups (n > 10). Control: PBS injection; model: LPS injection; DEX was used as positive control. The combined percentage of the medium and severe phenotypes was statistically analyzed among different groups. (E) The mRNA levels of IL-6, TNF-α, and CCL-2 in zebrafish embryos of different groups (n > 10). All the data are presented as the mean ± SEM of three independent experiments. # Compared with the control group; * compared with the model group; *, p < 0.05, ## or **, p < 0.01. |
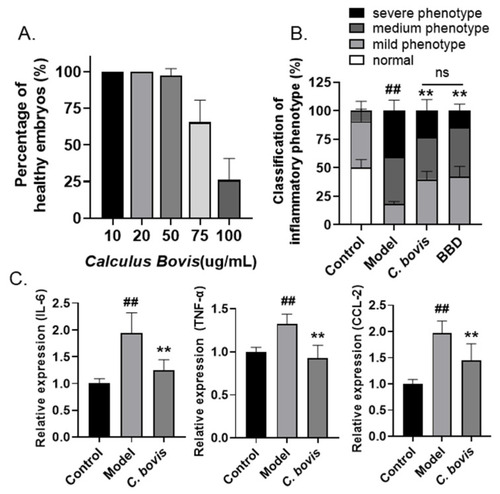
Anti-inflammatory effects of C. bovis on LPS-induced zebrafish inflammation model. (A) Toxicity of C. bovis treatment (n = 10). Larvae with cardiac edema, or body distortion, are defined as unhealthy. (B) The classification of inflammatory phenotypes in zebrafish embryos of different groups. The combined percentage of the medium and severe phenotypes was statistically analyzed among different groups (n > 10). Control: PBS injection; model: LPS injection. (C) The mRNA levels of IL-6, TNF-α, and CCL-2 in zebrafish embryos of different groups (n > 10). All the data are presented as the mean ± SEM of three independent experiments. # Compared with the control group; * compared with the model group; ## or **, p < 0.01. |
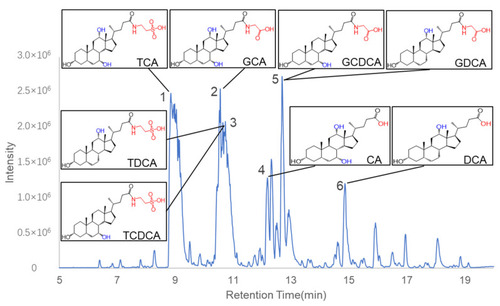
Base peak chromatogram of C. bovis in negative ion mode. Six peaks were identified as bile acids. The chemical structures of the eight major compounds chosen for the following studies were shown in boxes. |
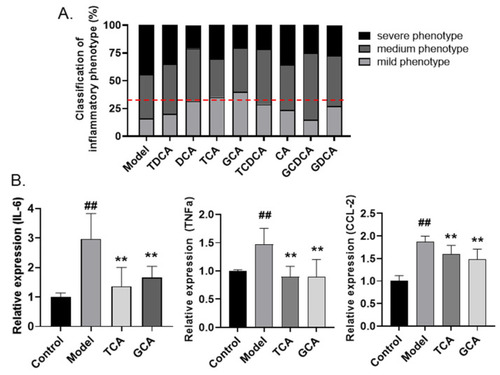
Screening active compounds of bile acids in zebrafish model. (A) The classification of inflammatory phenotypes in zebrafish embryos treated with different bile acids (n > 10). The cutoff line for positive hits is shown in red dotted line. (B) The mRNA levels of IL-6, TNF-α, and CCL-2 in zebrafish embryos of different groups (n > 10). Data are presented as the mean ± SEM of three independent experiments. # Compared with the control group; * compared with the model group; ## or **, p < 0.01. |
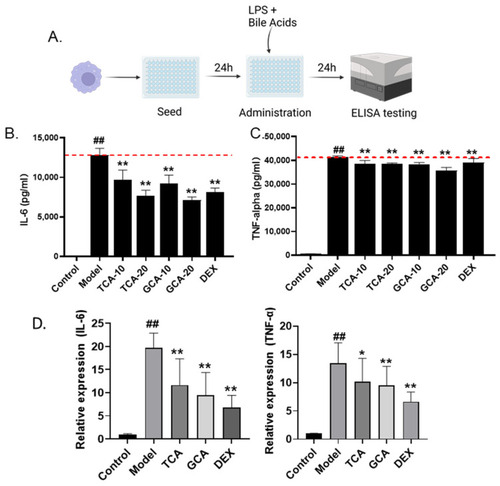
Validation of TCA and GCA in LPS-stimulated macrophages. (A) Flow chart of LPS-induced macrophage cell modeling. (B,C) The effect of TCA and GCA on the secretion of IL-6 and TNF-α in LPS-stimulated RAW264.7 cells. Each bile acid was tested at two concentrations of 10 and 20 µg/mL. DEX (8 µg/mL) is used as positive control. (D) Expression of inflammatory cytokines in TCA and GCA treated macrophages. All the data are presented as the mean ± SEM of three independent experiments. # Compared with the control group; *compared with the model group; *, p < 0.05, ## or **, p < 0.01. |
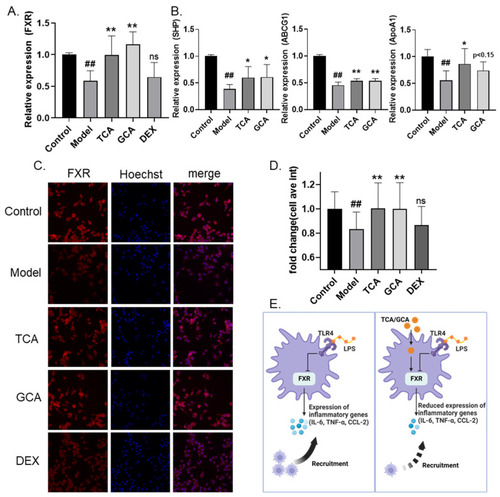
TCA and GCA increase the expression of FXR. (A) Increased FXR mRNA levels in bile acids-supplemented macrophage inflammation model. (B) Increased FXR downstream genes mRNA levels in bile acids-supplemented macrophage inflammation model. (C,D) Representative fluorescent images (C) and fluorescence quantification (D) of FXR immunofluorescence. (E) Schematic diagram of the proposed anti-inflammation mechanism of TCA and GCA. All the data are presented as the mean ± SEM of three independent experiments. # Compared with the control group; * compared with the model group; *, p < 0.05, ## or **, p < 0.01. |