
Image
|
Figure Caption
Figure 5
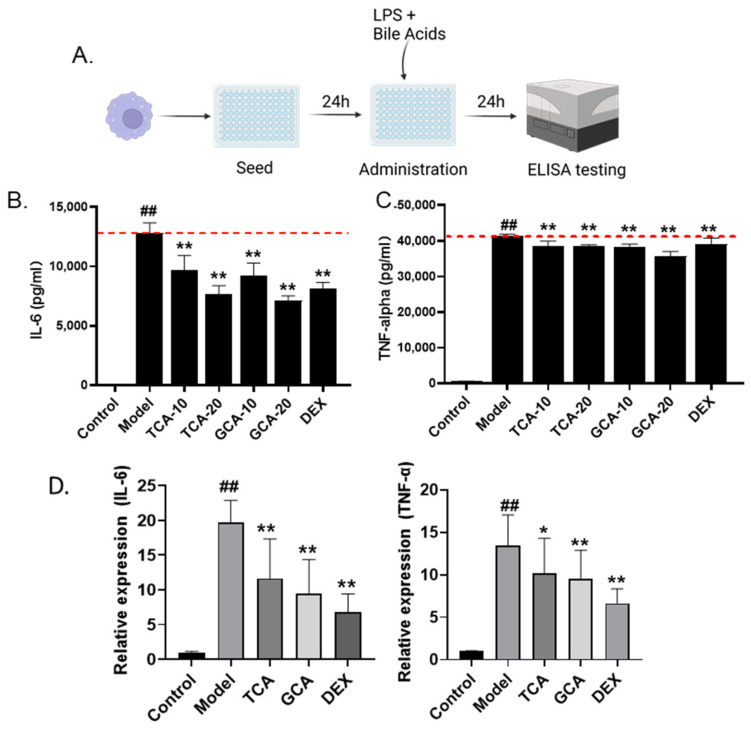
Validation of TCA and GCA in LPS-stimulated macrophages. (A) Flow chart of LPS-induced macrophage cell modeling. (B,C) The effect of TCA and GCA on the secretion of IL-6 and TNF-α in LPS-stimulated RAW264.7 cells. Each bile acid was tested at two concentrations of 10 and 20 µg/mL. DEX (8 µg/mL) is used as positive control. (D) Expression of inflammatory cytokines in TCA and GCA treated macrophages. All the data are presented as the mean ± SEM of three independent experiments. # Compared with the control group; *compared with the model group; *, p < 0.05, ## or **, p < 0.01.
Acknowledgments
This image is the copyrighted work of the attributed author or publisher, and
ZFIN has permission only to display this image to its users.
Additional permissions should be obtained from the applicable author or publisher of the image.
Full text @ Molecules