
Image
|
Figure Caption
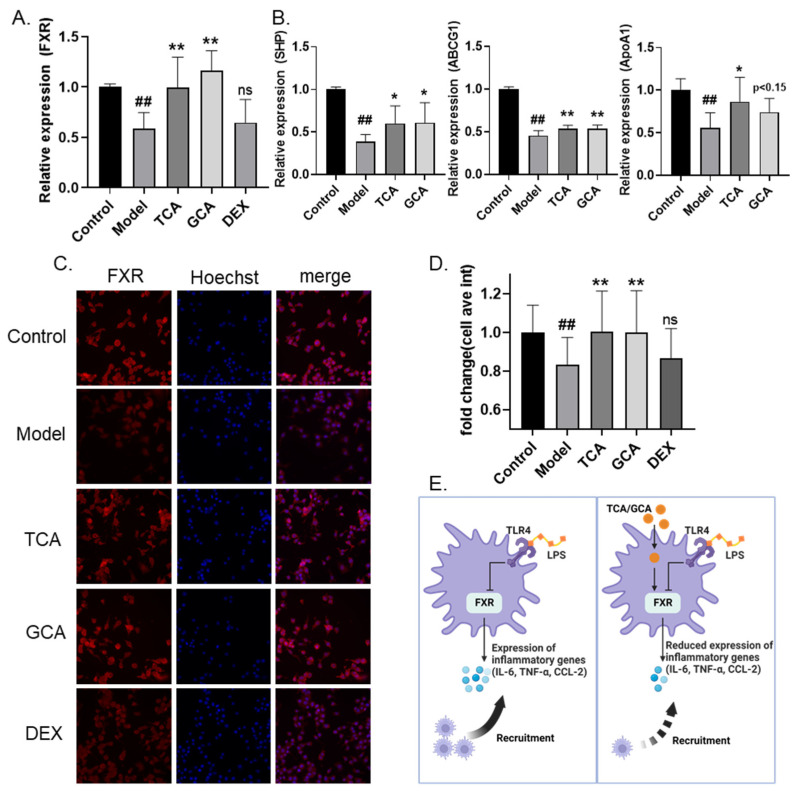
Figure 6
TCA and GCA increase the expression of FXR. (A) Increased FXR mRNA levels in bile acids-supplemented macrophage inflammation model. (B) Increased FXR downstream genes mRNA levels in bile acids-supplemented macrophage inflammation model. (C,D) Representative fluorescent images (C) and fluorescence quantification (D) of FXR immunofluorescence. (E) Schematic diagram of the proposed anti-inflammation mechanism of TCA and GCA. All the data are presented as the mean ± SEM of three independent experiments. # Compared with the control group; * compared with the model group; *, p < 0.05, ## or **, p < 0.01.
Acknowledgments
This image is the copyrighted work of the attributed author or publisher, and
ZFIN has permission only to display this image to its users.
Additional permissions should be obtained from the applicable author or publisher of the image.
Full text @ Molecules