
Image
|
Figure Caption
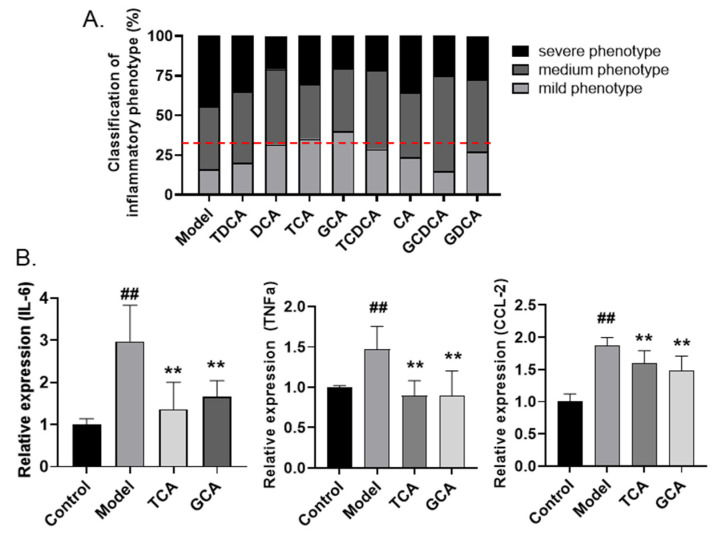
Figure 4
Screening active compounds of bile acids in zebrafish model. (A) The classification of inflammatory phenotypes in zebrafish embryos treated with different bile acids (n > 10). The cutoff line for positive hits is shown in red dotted line. (B) The mRNA levels of IL-6, TNF-α, and CCL-2 in zebrafish embryos of different groups (n > 10). Data are presented as the mean ± SEM of three independent experiments. # Compared with the control group; * compared with the model group; ## or **, p < 0.01.
Acknowledgments
This image is the copyrighted work of the attributed author or publisher, and
ZFIN has permission only to display this image to its users.
Additional permissions should be obtained from the applicable author or publisher of the image.
Full text @ Molecules