
- Title
-
Zn-Al layered double hydroxides induce embryo malformations and impair locomotion behavior in Danio rerio
- Authors
- Carneiro, D., Damasceno, É.P., Ferreira, V., Charlie-Silva, I., Tedim, J., Maia, F., Loureiro, S., Martins, R., Pavlaki, M.D.
- Source
- Full text @ NanoImpact
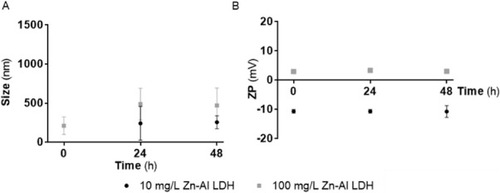
(A) Hydrodynamic size (mean ± standard deviation; nm) and potential zeta (mean ± standard deviation; mV) of Zn |
 Al LDH dispersions (10 and 100 mg/L) in zebrafish FSW over time (0, 24 and 48 h).
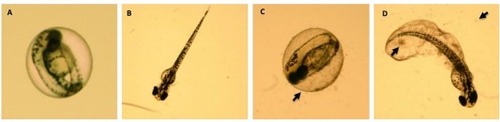
Embryos and larvae of Danio rerio after exposure to the control (A, embryo (48 h)); B, larvae (72 h)) and to the concentration of 84.5 mg Zn |
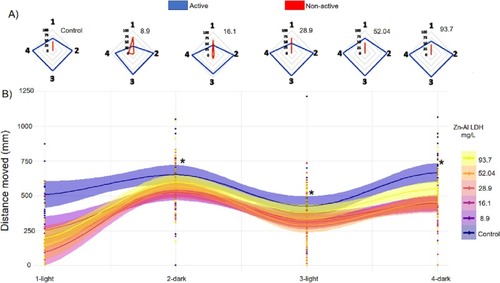
Fish activity, measured as distance (mm), after exposure to a range of concentrations of Zn |
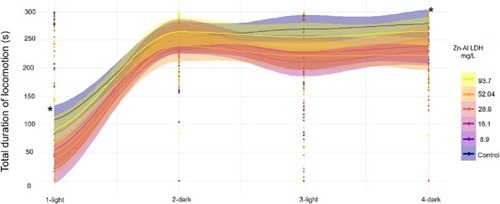
Total duration of locomotion (mean ± standard error) in seconds (s) during two alternating cycles of light/dark by Danio rerio larvae (n = 3) after 120 h exposure to Zn---Al LDH. Asterisk (*) indicates a significant difference (p < 0.05) between treatments and negative control. |
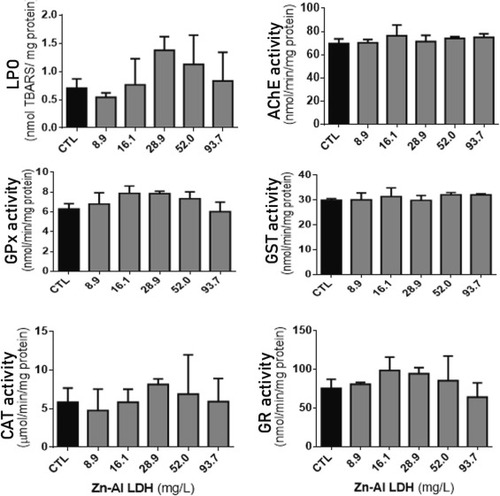
Biochemical endpoints measured in Danio rerio larvae (n = 3) after 120 h of exposure to 8.9–93.7 mg/L of Zn---Al LDH (mean ± standard deviation): lipid peroxidation (LPO; A) and enzymatic activity of acetylcholinesterase (AChE; B); glutathione peroxidase (GPx; C); glutathione-S-transferases (GSTs; D); catalase (CAT; E); glutathione reductase (GR; F). CTL – negative control. |
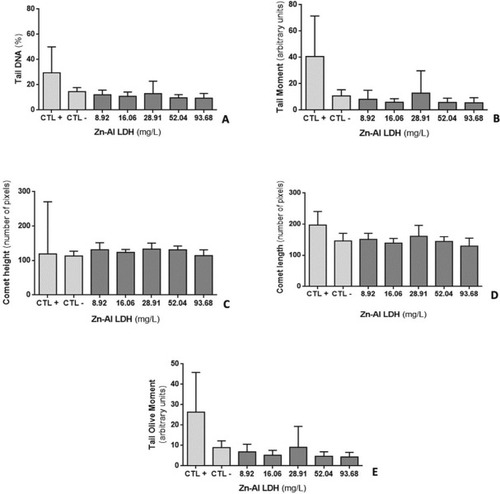
Comet assay results after 96 h exposure of Zn |
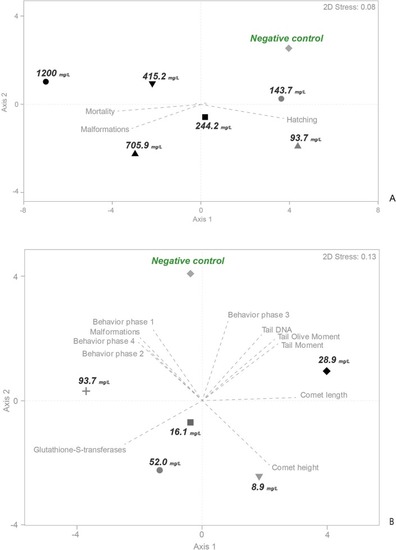
Metric multidimensional scaling analysis based on the Zn---Al exposure data, namely (A) embryotoxicity and (B) behavioral and biochemical effects and genotoxicity. Symbols and numbers represent each LDH exposure concentration in mg/L. Vectors represent the most correlated variables (Pearson r > 0.8) with the most relevant axes of each ordination plot. |