
Image
|
Figure Caption
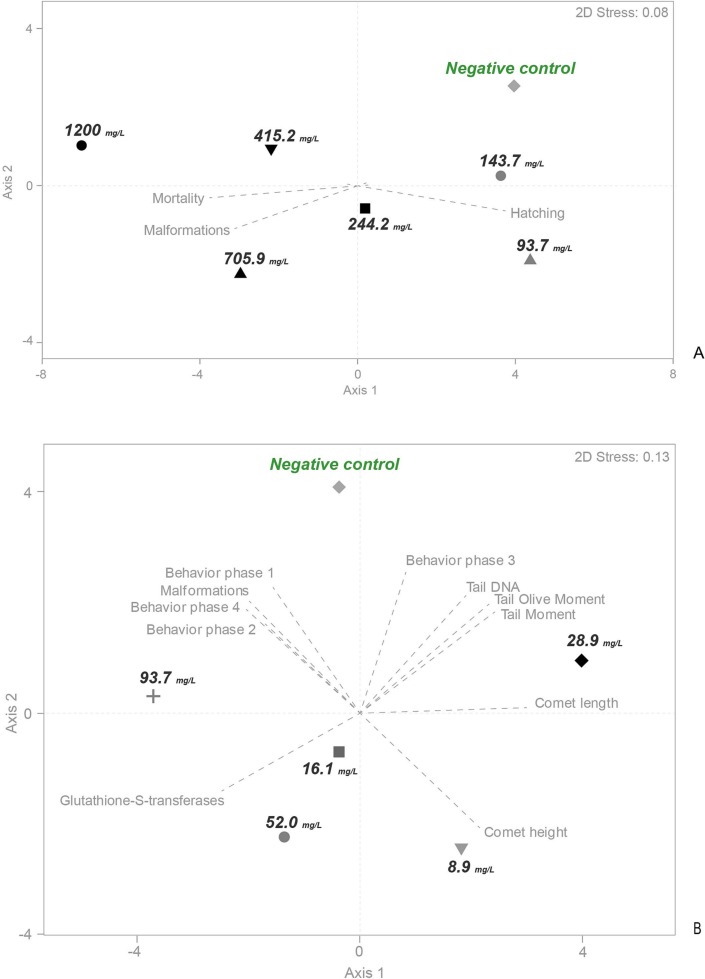
Fig. 7 Metric multidimensional scaling analysis based on the Zn---Al exposure data, namely (A) embryotoxicity and (B) behavioral and biochemical effects and genotoxicity. Symbols and numbers represent each LDH exposure concentration in mg/L. Vectors represent the most correlated variables (Pearson r > 0.8) with the most relevant axes of each ordination plot.
Acknowledgments
This image is the copyrighted work of the attributed author or publisher, and
ZFIN has permission only to display this image to its users.
Additional permissions should be obtained from the applicable author or publisher of the image.
Full text @ NanoImpact