
Image
|
Figure Caption
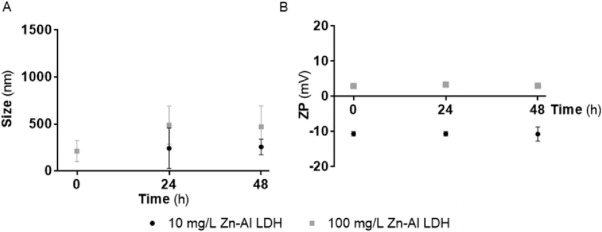
Fig. 1
(A) Hydrodynamic size (mean ± standard deviation; nm) and potential zeta (mean ± standard deviation; mV) of Zn Al LDH dispersions (10 and 100 mg/L) in zebrafish FSW over time (0, 24 and 48 h).
Acknowledgments
This image is the copyrighted work of the attributed author or publisher, and
ZFIN has permission only to display this image to its users.
Additional permissions should be obtained from the applicable author or publisher of the image.
Full text @ NanoImpact