- Title
-
Structure-based developmental toxicity and ASD-phenotypes of bisphenol A analogues in embryonic zebrafish
- Authors
- Bai, C., Zheng, Y., Tian, L., Lin, J., Song, Y., Huang, C., Dong, Q., Chen, J.
- Source
- Full text @ Ecotoxicol. Environ. Saf.
|
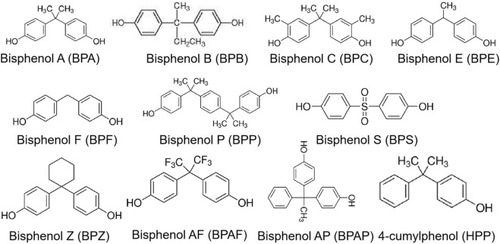
Fig. 1. Chemical structures of BPA and its 10 analogues. |
|
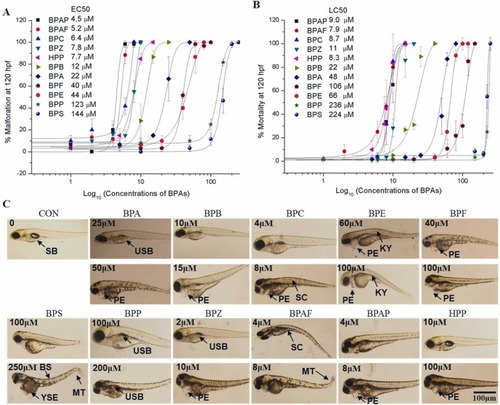
Fig. 2. Concentration-response analysis for malformation and mortality. Zebrafish embryos were exposed to BPA and its 10 analogues at a series of concentrations from 8 to 120 hpf. Malformation and mortality were assessed at 120 hpf. The concentration-response curves for malformation (A) and mortality (B) were used to calculate the EC50 and LC50. Values are plotted as the mean ± SEM (N = 60 with 20 embryos in triplicate). (C) Representative malformation phenotypes for exposure at different concentrations. SB, swim bladder; USB, uninflated swim bladder; PE, pericardial edema; YSE, yolk sac edema; BS, bent spine; MT, malformed tail. SC, scoliosis; KY, kyphosis. Scale bar, 100 µm. |
|
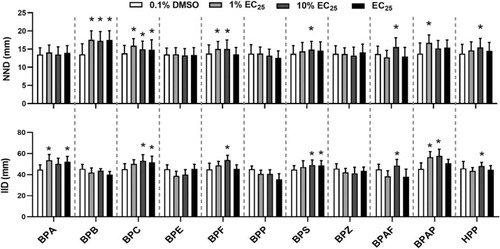
Fig. 3. Sublethal concentration exposure causes shoaling behavior deficits. Zebrafish embryos exposed to BPA and its 10 analogues at 0 (0.1 % DMSO), 1 %, 10 %, and 100 % EC25 from 8 hpf to 4.5 dpf were assessed for shoaling at 11 dpf. NND, nearest neighbor distance; IID, inter-individual distance. Values are plotted as the mean ± SEM (N = 20), and the asterisk (*) indicates a significant difference from the vehicle control (0.1 % DMSO) at P < 0.05. |
|
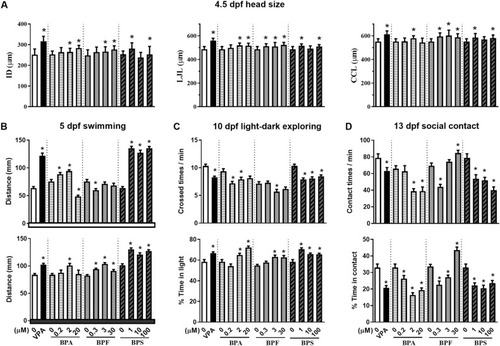
Fig. 4. BPA, BPF, and BPS produce macrocephaly, hyperactivity and ASD-like behavior deficits. Zebrafish embryos exposed to BPA, BPF, and BPS at 0 (0.1 % DMSO), 1 %, 10 %, and 100 % EC25 from 8 hpf to 4.5 dpf. VPA at 5 μM was included as the positive control. (A) Head size t at 5 dpf measured through alcian blue staining with parameters: intraocular distance (ID), lower jaw length (LJL), and ceratohyal cartilage length (CCL), (N = 27–42). (B) Larval locomotion at 5 dpf in a 10 min light period followed by a 10 min dark period (N = 24). (C) Light/dark exploration for larvae at 10 dpf (N = 24). (D) Social contact for larvae at 13 dpf (N = 24). Values are plotted as the mean ± SEM, and the asterisk (*) indicates a significant difference from the vehicle control (0.1 % DMSO) at P < 0.05. |
|
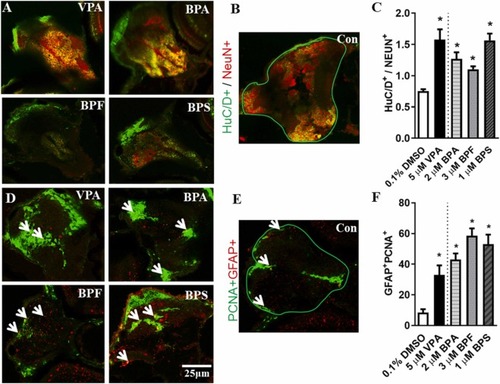
Fig. 5. BPA, BPF, and BPS accelerate neurogenesis. Zebrafish embryos exposed to 0.1 %DMSO (vehicle control), BPA (2 μM), BPF (3 μM), BPS (1 μM), and VPA (5 μM; positive control) from 8 to 108 hpf were assessed for neurogenesis at 4.5 dpf. (A) Staining patterns of mature newborn neurons (HuC/D+; green) and mature neurons (NeuN+; red) on tissue sections from the anterior telencephalon position. (B) The region of interest in the anterior telencephalon used for fluorescence intensity quantification. (C) The ratio of fluorescence intensity of HuC/D+ to NEUN+ (N = 6–10). (D) Staining patterns of neural stem cells (GFAP+; red) and cell proliferation marker (PCNA+; green) on tissue sections from the anterior telencephalon position. (E) The region of interest in the anterior telencephalon used for counting GFAP+PCNA+ cells. Arrows indicate double positive cells. (F) Quantification of GFAP+PCNA+ cells (N = 4–10). Values are plotted as the mean ± SEM, and the asterisk (*) indicates a significant difference from the vehicle control (0.1 % DMSO) at P < 0.05. Scale bar, 25 µm. |
|
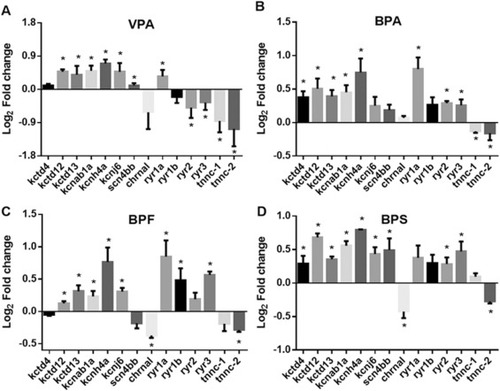
Fig. 6. BPA, BPF, and BPS upregulate K+ ion channel related genes. Zebrafish embryos exposed to 0.1 %DMSO (vehicle control), BPA (2 μM), BPF (3 μM), BPS (1 μM), and VPA (5 μM; positive control) from 8 to 120 hpf were collected at 120 hpf for gene expression analysis. Gene expression fold change (Log2) for larvae exposed to VPA (A), BPA (B), BPF (C), and BPS (D). Genes related to K+ channel: K+ channel tetramerization domain containing 4 (kctd4), kctd12, kctd13, K+ voltage-gated channel shaker-related subfamily, beta member 1 a(kcnab1a), K+ voltage-gated channel, subfamily H (eag-related), member 4a (kcnh4a), K+ inwardly-rectifying channel, subfamily J, member 6 (kchj6). Genes related to calcium ion channel: ryanodine receptor 1a (ryr1a), ryr1b, ryr2, ryr3, troponin C type 1a (tnnc-1), and tnnc-2. Sodium ion channel gene: voltage-gated, type IV, beta b (scn4bb). Acetylcholine receptor gene: cholinergic receptor nicotinic alpha 1 subunit (chrna1). Values are plotted as the mean ± SEM (N = 3, pooled sample from 20 larvae per replicate), and the asterisk (*) indicates a significant difference from the vehicle control (0.1 % DMSO) at P < 0.05. |

