Fig. 2
- ID
- ZDB-FIG-230810-19
- Publication
- Bai et al., 2023 - Structure-based developmental toxicity and ASD-phenotypes of bisphenol A analogues in embryonic zebrafish
- Other Figures
- All Figure Page
- Back to All Figure Page
|
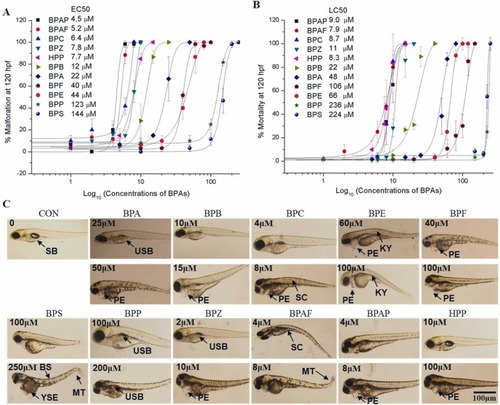
Fig. 2. Concentration-response analysis for malformation and mortality. Zebrafish embryos were exposed to BPA and its 10 analogues at a series of concentrations from 8 to 120 hpf. Malformation and mortality were assessed at 120 hpf. The concentration-response curves for malformation (A) and mortality (B) were used to calculate the EC50 and LC50. Values are plotted as the mean ± SEM (N = 60 with 20 embryos in triplicate). (C) Representative malformation phenotypes for exposure at different concentrations. SB, swim bladder; USB, uninflated swim bladder; PE, pericardial edema; YSE, yolk sac edema; BS, bent spine; MT, malformed tail. SC, scoliosis; KY, kyphosis. Scale bar, 100 µm. |

