
- Title
-
Polygoni multiflori radix exacerbates idiosyncratic inflammatory liver injury through the FXR-SHP pathway and altered pharmacokinetic behavior
- Authors
- Zhang, G., Sun, J., Liu, M., Tian, Z., Ma, Z., Hao, B., Ning, J., Ren, X., Wang, M., Wang, P., Li, J., Li, H., Ni, J., Liu, Y.
- Source
- Full text @ Biomed. Pharmacother.
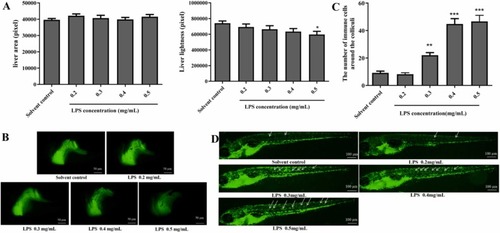
Fig. 1. Effects of different concentrations of LPS on zebrafish. (A) Effects of different concentrations of LPS on the liver area and brightness in zebrafish (mean ± SEM, n = 10); (B) Phenotypes of liver toxicity in zebrafish induced by different concentrations of LPS (× 200); (C) Effects of different concentrations of LPS on the number of immune cells around the colliculi (mean ± SEM, n = 10) (D) Effects of different concentrations of LPS on inflammatory response phenotypes (× 100). *P < 0.05, **P < 0.01, ***P < 0.001 vs. Solvent control by one-way ANOVA with Turkey’s test. |
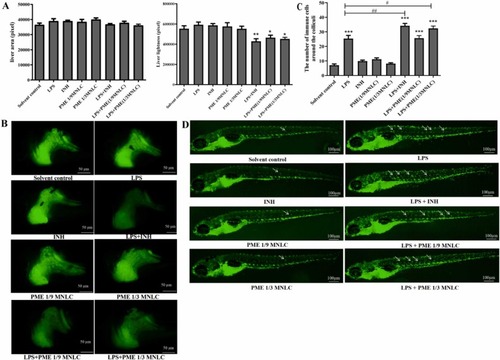
Fig. 2. Effects of PME on zebrafish. (A) Effect of PME on total liver area and brightness in zebrafish (mean ± SEM, n = 10); (B) Hepatotoxicity phenotype induced by PME (× 200); (C) Effects of PME on the number of immune cells around the colliculi (mean ± SEM, n = 10) ***P < 0.001 vs. Solvent control; #P < 0.05, ##P < 0.01 vs. LPS; (D) Inflammatory response phenotype induced by PME (× 100). *P < 0.05, **P < 0.01, ***P < 0.001 vs. Solvent control; #P < 0.05, ##P < 0.01 vs. LPS by one-way ANOVA with Turkey’s test. |
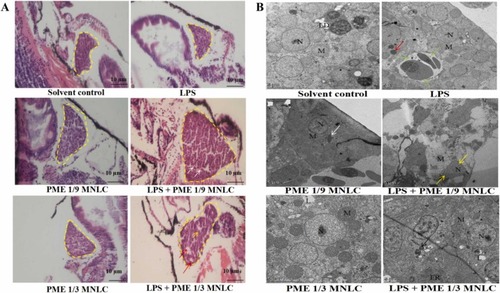
Fig. 3. Pathological analysis of PME-induced liver injury in zebrafish. (A) Histopathological section of liver (× 1000); (B) Ultrastructure of the liver by electron microscopy (× 2000) N: cell nucleus, M: mitochondria, LD: lipid droplets, ER: endoplasmic reticulum, L: lysosome. |

Fig. 4. Effects of PME on the expression of transaminases and inflammatory factors in zebrafish liver. (A) Effects of PME on ALT and AST activities in zebrafish (mean ± SEM, n = 3); (B) Changes in mRNA expression of inflammatory factors and FXR-SHP axis-related genes in zebrafish by PME detected by Q-PCR (mean ± SEM, n = 3) *P < 0.05, **P < 0.01, ***P < 0.001 vs. Solvent control; #P < 0.05, ##P < 0.01, ###P < 0.001 vs. PME (1/9 MNLC, 1/3 MNLC) by one-way ANOVA with Turkey’s test. |
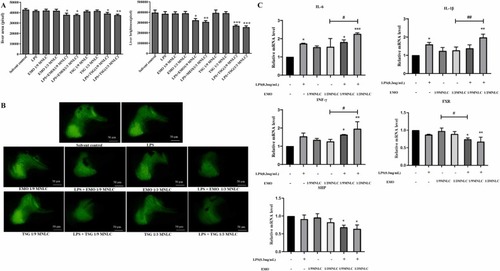
Fig. 5. Effect of EMO and TSG on zebrafish liver. (A) Effect of EMO and TSG on the area and total brightness in zebrafish liver (mean ± SEM, n = 10); (B) Phenotype of hepatotoxicity induced by EMO and TSG (× 200); (C) Changes in mRNA expression of inflammatory factors and FXR-SHP axis-related genes in zebrafish by EMO detected by Q-PCR (mean ± SEM, n = 3) *P < 0.05, **P < 0.01, ***P < 0.001 vs. Solvent control; #P < 0.05, ##P < 0.01 vs. 1/3 PME (1/9 MNLC, 1/3 MNLC) by one-way ANOVA with Turkey’s test. |
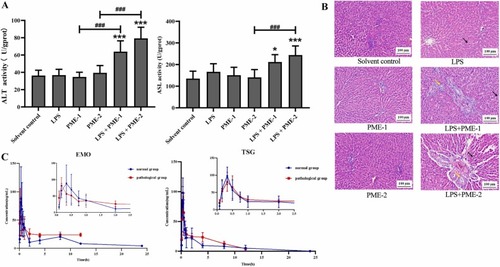
Fig. 6. Effect of PME on rat liver and blood concentration-time profiles of the major components in PME. (A) Serum ALT and AST activities in rats (mean ± SD, n = 3); (B) Histopathological changes in rat liver (× 200) (C) The concentration-time curves of EMO and TSG in rats after oral administration of PME. *P<0.05, ***P< 0.001 vs. Solvent control; ###P <0.001 vs. PME by one-way ANOVA with Turkey’s test. |
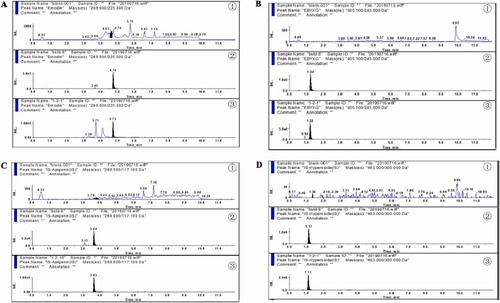
Fig. 7. MRM chromatograms of the analytes in rat plasma. (A) EMO, (B) TSG, (C) I.S.1-Apigenin, (D) I.S.2-Hyperoside (① blank plasma, ② blank rat plasma spiked with standard compounds ③ plasma samples after oral administration of PME). |