
Image
|
Figure Caption
Fig. 2
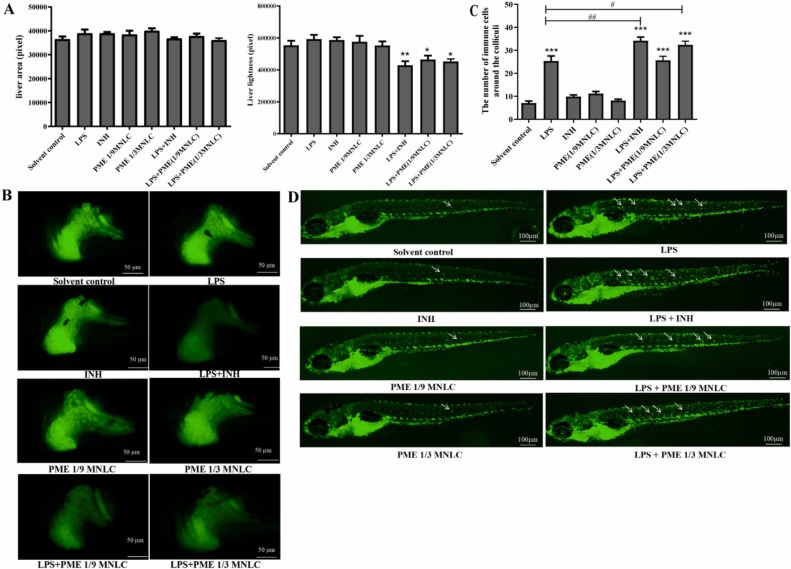
Fig. 2. Effects of PME on zebrafish. (A) Effect of PME on total liver area and brightness in zebrafish (mean ± SEM, n = 10); (B) Hepatotoxicity phenotype induced by PME (× 200); (C) Effects of PME on the number of immune cells around the colliculi (mean ± SEM, n = 10) ***P < 0.001 vs. Solvent control; #P < 0.05, ##P < 0.01 vs. LPS; (D) Inflammatory response phenotype induced by PME (× 100). *P < 0.05, **P < 0.01, ***P < 0.001 vs. Solvent control; #P < 0.05, ##P < 0.01 vs. LPS by one-way ANOVA with Turkey’s test.
Acknowledgments
This image is the copyrighted work of the attributed author or publisher, and
ZFIN has permission only to display this image to its users.
Additional permissions should be obtained from the applicable author or publisher of the image.
Full text @ Biomed. Pharmacother.