
Image
|
Figure Caption
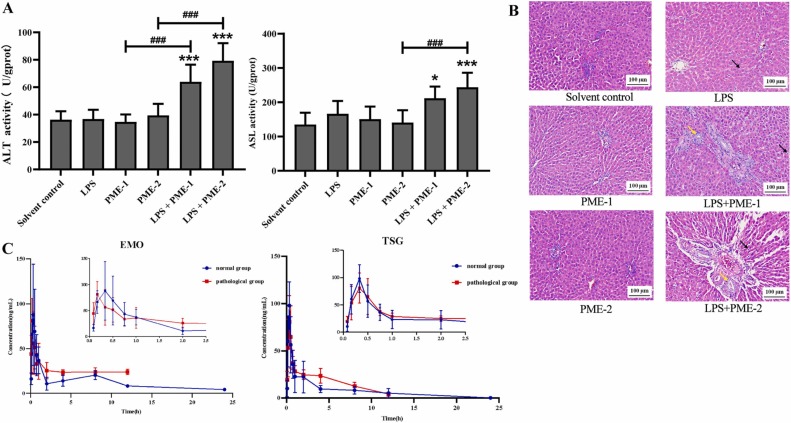
Fig. 6
Fig. 6. Effect of PME on rat liver and blood concentration-time profiles of the major components in PME. (A) Serum ALT and AST activities in rats (mean ± SD, n = 3); (B) Histopathological changes in rat liver (× 200) (C) The concentration-time curves of EMO and TSG in rats after oral administration of PME. *P<0.05, ***P< 0.001 vs. Solvent control; ###P <0.001 vs. PME by one-way ANOVA with Turkey’s test.
Acknowledgments
This image is the copyrighted work of the attributed author or publisher, and
ZFIN has permission only to display this image to its users.
Additional permissions should be obtained from the applicable author or publisher of the image.
Full text @ Biomed. Pharmacother.