
Image
|
Figure Caption
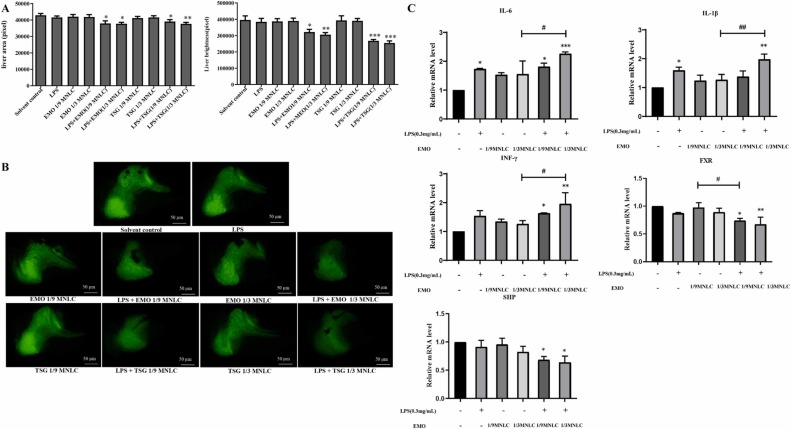
Fig. 5
Fig. 5. Effect of EMO and TSG on zebrafish liver. (A) Effect of EMO and TSG on the area and total brightness in zebrafish liver (mean ± SEM, n = 10); (B) Phenotype of hepatotoxicity induced by EMO and TSG (× 200); (C) Changes in mRNA expression of inflammatory factors and FXR-SHP axis-related genes in zebrafish by EMO detected by Q-PCR (mean ± SEM, n = 3) *P < 0.05, **P < 0.01, ***P < 0.001 vs. Solvent control; #P < 0.05, ##P < 0.01 vs. 1/3 PME (1/9 MNLC, 1/3 MNLC) by one-way ANOVA with Turkey’s test.
Acknowledgments
This image is the copyrighted work of the attributed author or publisher, and
ZFIN has permission only to display this image to its users.
Additional permissions should be obtained from the applicable author or publisher of the image.
Full text @ Biomed. Pharmacother.