
- Title
-
CD24+CD44+CD54+EpCAM+ gastric cancer stem cells predict tumor progression and metastasis: clinical and experimental evidence
- Authors
- Gómez-Gallegos, A.A., Ramírez-Vidal, L., Becerril-Rico, J., Pérez-Islas, E., Hernandez-Peralta, Z.J., Toledo-Guzmán, M.E., García-Carrancá, A., Langley, E., Hernández-Guerrero, A., López-Casillas, F., Herrera-Goepfert, R., Oñate-Ocaña, L.F., Ortiz-Sánchez, E.
- Source
- Full text @ Stem Cell Res. Ther.

Determination of stem cell markers and their Relationship with the Clinical Outcome of Gastric Cancer Patients. A Evaluation of 8 surface markers related to CSC in CD45− cells from 127 biopsies of gastric cancer patients. Error bars represent ± SD. B Plots of CD24+CD44+CD54+EpCAM+ (GCEP) cell percentage in patients with gastric cancer with metastasis and patients with localized gastric cancer. Error bars represent ± SD. ***p < 0.001. C Kaplan–Meier survival graph of patients with high (> 1.19) or low (< 1.19) %GCEP. No significant differences were observed between groups in the Log-rank test |
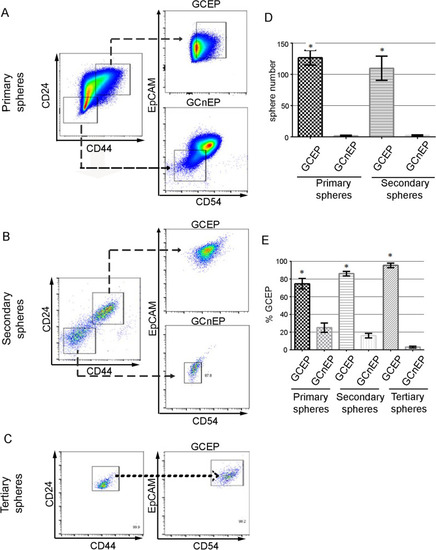
CD24+CD44+CD54+EpCAM+ cells show Cancer Stem cell properties. (A–C) Cell differentiation potential of GCEP (CD24+CD44+CD54+EpCAM+). Cells were able to generate different phenotypes under the same cell culture conditions. A Primary tumorspheres, B Secondary tumorspheres came from GCEP cells derived from primary tumorspheres. C Tertiary tumorspheres came from GCEP cells derived from secondary tumorspheres. D GCEP cells showed greater capacity to form secondary and tertiary tumorspheres after sorting. Only the GCEP cell subpopulation was able to form secondary and tertiary spheres. E Percentage of cells with GCEP and GCnEP (CD24−CD44−CD54−EpCAM−) cells present in primary, secondary, and tertiary tumorspheres. Error bars indicate the ± SD of three independent assays. *P ≤ 0.05 |

Xenotransplanted gastric cancer GCEP cells migrate and form metastasis in zebrafish. A Cell migration after 1 and 6 dpi of 50 GCnEP cells (panels I and II, respectively) or GCEP cells (panels III and IV, respectively). Double arrowheads and insets indicate the site of injection, arrows highlight the sites with cell migration. Cyan fluorescence marks vascular endothelium in Tg(fli-1:EGFP)y1 zebrafish transgenic larvae. B, C Transversal section showing the caudal portion of a 6 dpi Tg(fli-1:EGFP)y1 zebrafish larvae injected with GCEP cells. The white arrowhead shows a GCEP cell traveling inside the caudal artery in panel B. Arrowhead showing a metastatic tumor in the distal portion of the intestine at the level of the somites 14–16 in panel C. D Percentage of embryos with migration of cells at 1, 2, 3 and 4 days post-injection (dpi); embryos showing disseminated cells far from the sites of injection were counted. All image acquisition was carried out in a Nikon SMZ1500 stereomicroscope. All scale bars indicate 100 μM |

GCEP cells have invasion, migration, and proangiogenic capabilities. Transversal 15 mm sections at the trunk level of fli-1 zebrafish larvae after 6 dpi with 50 GCEP cells. A, E H&E-stained sections; dashed line in 4A shows an aberrant vessel or a group of vessels, and black arrowhead shows cells moving from the yolk to the intestinal bulb (IB), inset in E. B–D Confocal images of transversal sections showing CM-Dil-stained GCEP cells in orange, cyan marking endothelial cells from a Tg(fli-1:EGFP)y1 zebrafish larvae, and Hoechst stained nuclei in light gray. Pink arrowheads indicate the large vessel observed in panel A, B. White arrows and arrowheads show injected cells with high and low fluorescence intensity, respectively. C, D insets indicated in panel B, dashed line in panel D showing an irrigated tumor. F side view of a larvae indicating sectioning site. All scale bars indicate 100 μM. Images were acquired with a Zeiss confocal microscope LSM800 or Axio Zoom V16, stereomicroscope |

Mucin expression in cells derived from injected zebrafish. A–F Transversal sections near the level of injection site. A–C Alcian blue-PAS staining images of serial histological slices (AB-PAS). A, D Uninfected zebrafish. B, E Zebrafish transversal sections 4 dpi with GCEP cells. White arrows indicate misplaced cellular structure similar to blood vessels structures. Black arrows show tumor cell structures. C, F Transversal section of a zebrafish injected with GCnEP cells. The black arrows in B, C, E, F show tumor cell mass disrupting the intestinal bulb. Lipids and proteins from the vitelum (white arrowheads). All scale bars indicate 100 μM. Images were acquired with a ZEISS Axio Zoom V16 and processed in Zen 2.6 blue edition, Zeiss |