
|
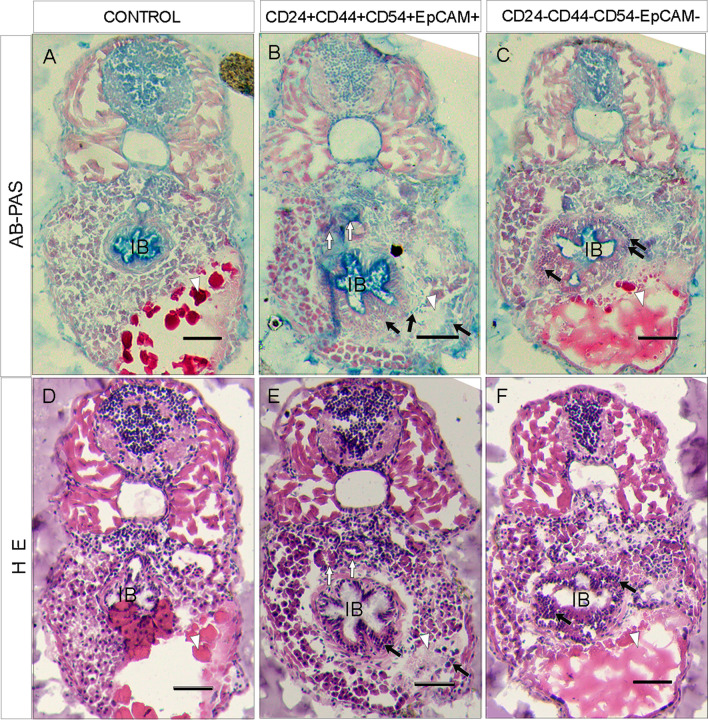
Fig. 5
Mucin expression in cells derived from injected zebrafish. A–F Transversal sections near the level of injection site. A–C Alcian blue-PAS staining images of serial histological slices (AB-PAS). A, D Uninfected zebrafish. B, E Zebrafish transversal sections 4 dpi with GCEP cells. White arrows indicate misplaced cellular structure similar to blood vessels structures. Black arrows show tumor cell structures. C, F Transversal section of a zebrafish injected with GCnEP cells. The black arrows in B, C, E, F show tumor cell mass disrupting the intestinal bulb. Lipids and proteins from the vitelum (white arrowheads). All scale bars indicate 100 μM. Images were acquired with a ZEISS Axio Zoom V16 and processed in Zen 2.6 blue edition, Zeiss