
- Title
-
An environmentally relevant concentration of antibiotics impairs the immune system of zebrafish (Danio rerio) and increases susceptibility to virus infection
- Authors
- Pereiro, P., Rey-Campos, M., Figueras, A., Novoa, B.
- Source
- Full text @ Front Immunol
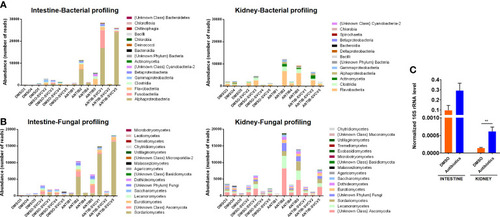
Microbiota abundance. Absolute abundance of the main (A) bacterial and (B) fungal classes in intestine and kidney samples from zebrafish exposed to SMX+CLA or the vehicle alone and infected or not with SVCV. (C) The total abundance of bacteria was measured in the intestine and kidney of uninfected SMX+CLA- or DMSO-treated fish by qPCR detection of the 16S rRNA using the universal primer pair PSL-PSR. Statistically significant differences are displayed as ** (p<0.01). |
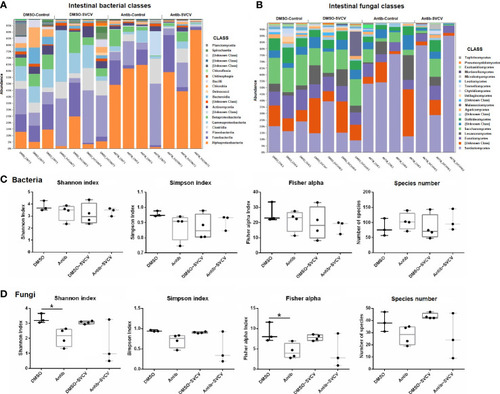
Taxa relative abundances in the intestine of zebrafish treated with DMSO (vehicle) or SMX+CLA under SVCV-infected and uninfected conditions. (A) Relative abundance of the main bacterial classes. (B) Relative abundance of the main fungal classes. (C) Shannon entropy, Simpson, Fisher alpha and species number indices of (C) bacteria and (D) fungi in the intestine of the experimental groups. Statistically significant differences are displayed as * (p<0.05) after the Mann−Whitney U test. |
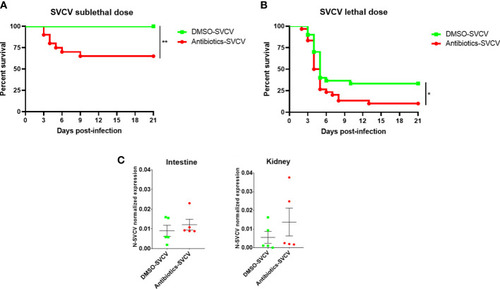
The long-term exposure of zebrafish to SMX+CLA conditions their resistance to SVCV. Kaplan−Meier survival curves of SMX+CLA- or DMSO-treated fish infected with a (A) sublethal or (B) lethal dose of SVCV. Statistically significant differences are displayed as ** (p<0.01). No mortality events were registered for the uninfected fish. (C) qPCR detection of the SVCV N gene in the intestine and kidney of zebrafish infected with SVCV at 24 hpi. |
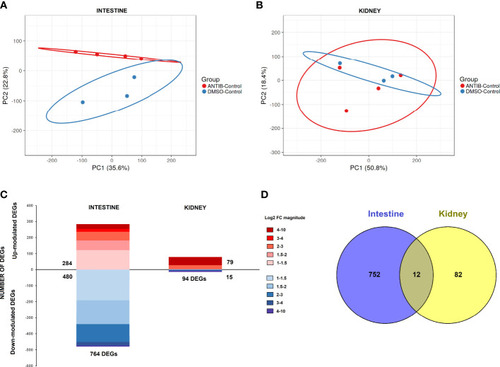
Comparative transcriptome analyses of zebrafish exposed to antibiotics or vehicle (DMSO) in the absence of infection. Principal component analyses (PCAs) of the (A) intestine and (B) kidney. (C) Stacked column charts reflecting the number and intensity (in log2 FC value) of the DEGs in the intestine and kidney of fish exposed to SMX+CLA for 2 weeks compared to the corresponding control (DMSO-treated fish). (D) Venn diagram showing the number of common and exclusive DEGs in the intestine and kidney. |
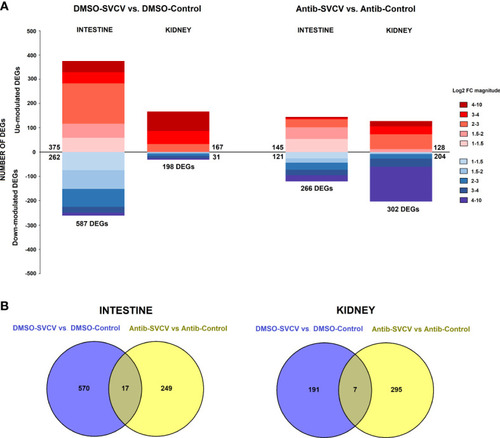
Comparative transcriptome analyses of zebrafish exposed to antibiotics or vehicle (DMSO) and infected with SVCV. (A) Stacked column charts reflecting the number and intensity (in log2 FC value) of the DEGs in the intestine and kidney at 24 hpi with SVCV. (B) Venn diagrams showing the number of common and exclusive DEGs after SVCV infection in DMSO- and SMX+CLA-treated fish. |
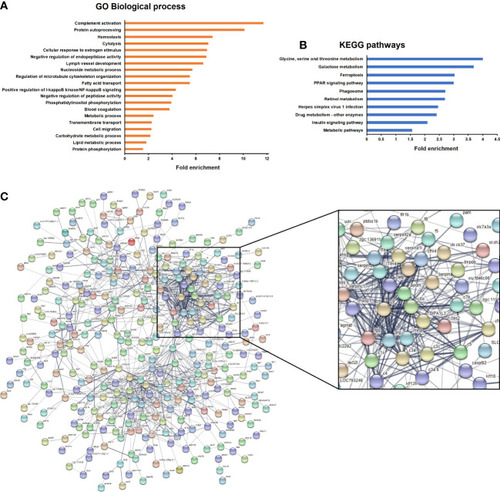
Enrichment analyses of the genes significantly modulated in the intestine of fish after exposure to antibiotics compared to the DMSO-treated group. (A) Significantly enriched GO biological processes. (B) Significantly enriched KEGG pathways. (C) String protein−protein interaction network showing the main gene clusters modulated by exposure to antibiotics. |
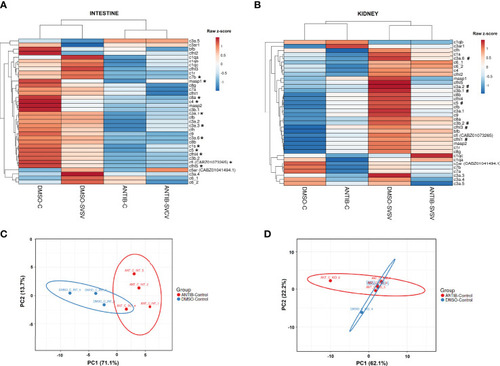
Analysis of the complement components. Heatmaps representing the mean TPM values of the different complement components in the (A) intestine and (B) kidney of the four experimental groups (DMSO-C, DMSO-SVCV, ANTIB-C and ANTIB-SVCV). * Indicates statistically significant differences between the ANTIB-C and DMSO-C groups; # indicates statistically significant differences between the DMSO-SVCV and DMSO-C groups. PCA of the complement genes in the (C) intestine and (D) kidney of the DMSO-control and antibiotics-control groups. |
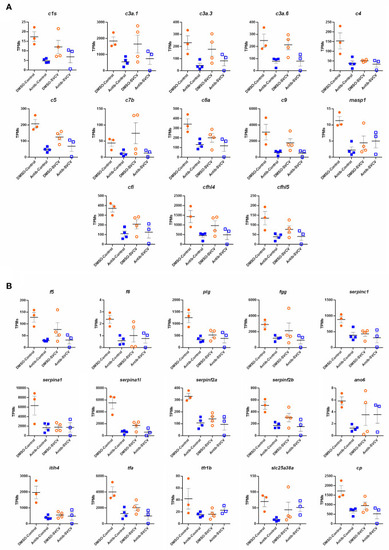
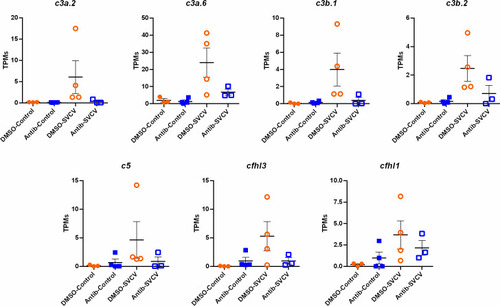
Representation of the TPM values of the (A) complement and (B) coagulation genes significantly modulated in the intestines of fish exposed to SMX-CLA compared to those exposed to DMSO (vehicle). |
Representation of the TPM values of the complement genes significantly modulated in the kidneys of fish exposed to DMSO after challenge with SVCV (DMSO-SVCV) compared with the DMSO-control group. |
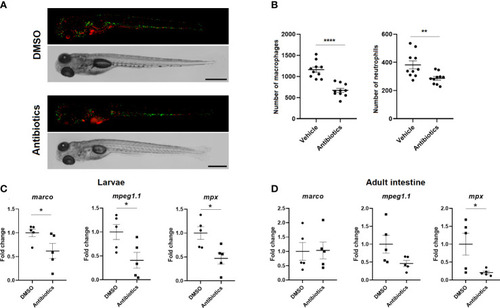
Effect of long-term exposure to SMX+CLA on the number of innate immune cells. (A) Representative images of double transgenic Tg(mpeg:mCherry/mpx:GFP) zebrafish larvae exposed to vehicle alone (DMSO) or SMX+CLA for 7 days. Scale bar: 500 µm. (B) Macrophage and neutrophil counts in DMSO- and SMX+CLA-treated larvae. Statistically significant differences are displayed as **** (p<0.0001) and ** (p<0.01). (C) Expression level of the macrophage (marco, mpeg1.1) and neutrophil (mpx) gene cell markers in DMSO- and SMX+CLA-treated larvae for 7 days and (D) in the intestine of adult zebrafish exposed to the treatments for 2 weeks. Statistically significant differences are displayed as * (p<0.05). |