
IMAGE
Figure 7
- ID
- ZDB-IMAGE-230131-50
- Publication
- Pereiro et al., 2023 - An environmentally relevant concentration of antibiotics impairs the immune system of zebrafish (Danio rerio) and increases susceptibility to virus infection
- All Figures
- Figures for Pereiro et al., 2023
Image
|
Figure Caption
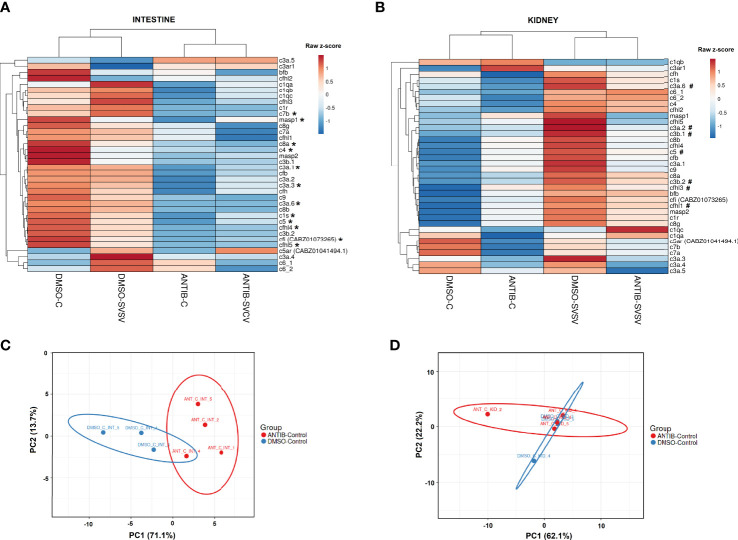
Figure 7
Analysis of the complement components. Heatmaps representing the mean TPM values of the different complement components in the (A) intestine and (B) kidney of the four experimental groups (DMSO-C, DMSO-SVCV, ANTIB-C and ANTIB-SVCV). * Indicates statistically significant differences between the ANTIB-C and DMSO-C groups; # indicates statistically significant differences between the DMSO-SVCV and DMSO-C groups. PCA of the complement genes in the (C) intestine and (D) kidney of the DMSO-control and antibiotics-control groups.
Acknowledgments
This image is the copyrighted work of the attributed author or publisher, and
ZFIN has permission only to display this image to its users.
Additional permissions should be obtained from the applicable author or publisher of the image.
Full text @ Front Immunol