
IMAGE
Figure 9
- ID
- ZDB-IMAGE-230131-52
- Publication
- Pereiro et al., 2023 - An environmentally relevant concentration of antibiotics impairs the immune system of zebrafish (Danio rerio) and increases susceptibility to virus infection
- All Figures
- Figures for Pereiro et al., 2023
Image
|
Figure Caption
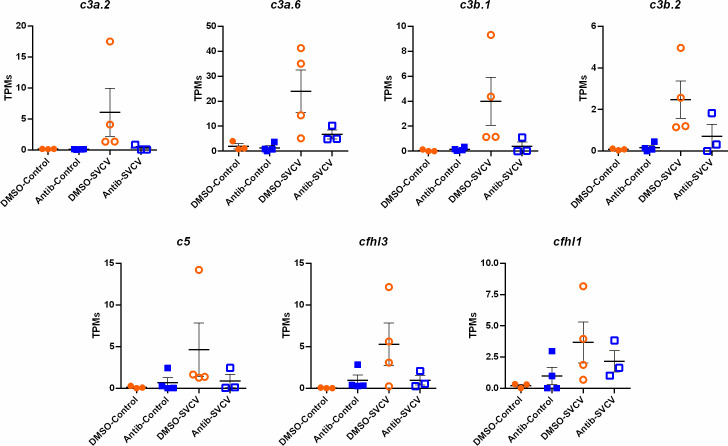
Figure 9
Representation of the TPM values of the complement genes significantly modulated in the kidneys of fish exposed to DMSO after challenge with SVCV (DMSO-SVCV) compared with the DMSO-control group.
Acknowledgments
This image is the copyrighted work of the attributed author or publisher, and
ZFIN has permission only to display this image to its users.
Additional permissions should be obtained from the applicable author or publisher of the image.
Full text @ Front Immunol