
IMAGE
Figure 4
- ID
- ZDB-IMAGE-230131-39
- Publication
- Pereiro et al., 2023 - An environmentally relevant concentration of antibiotics impairs the immune system of zebrafish (Danio rerio) and increases susceptibility to virus infection
- All Figures
- Figures for Pereiro et al., 2023
Image
|
Figure Caption
Figure 4
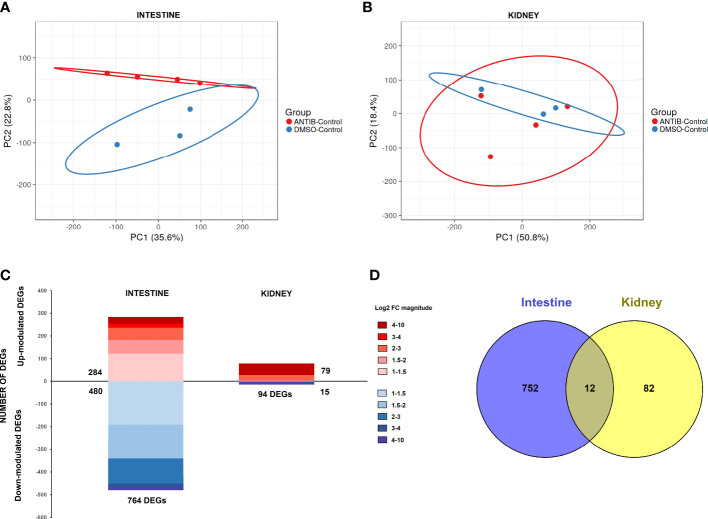
Comparative transcriptome analyses of zebrafish exposed to antibiotics or vehicle (DMSO) in the absence of infection. Principal component analyses (PCAs) of the (A) intestine and (B) kidney. (C) Stacked column charts reflecting the number and intensity (in log2 FC value) of the DEGs in the intestine and kidney of fish exposed to SMX+CLA for 2 weeks compared to the corresponding control (DMSO-treated fish). (D) Venn diagram showing the number of common and exclusive DEGs in the intestine and kidney.
Acknowledgments
This image is the copyrighted work of the attributed author or publisher, and
ZFIN has permission only to display this image to its users.
Additional permissions should be obtained from the applicable author or publisher of the image.
Full text @ Front Immunol