
- Title
-
Protein phosphatase 2A activators reverse age-related behavioral changes by targeting neural cell senescence
- Authors
- Xing, J., Chen, K., Gao, S., Pousse, M., Ying, Y., Wang, B., Chen, L., Wang, C., Wang, L., Hu, W., Lu, Y., Gilson, E., Ye, J.
- Source
- Full text @ Aging Cell
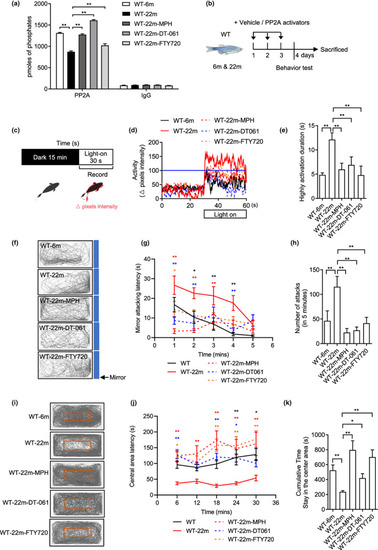
PP2A activators reverse the behavioral changes of old fish. (a) PP2A phosphatase assay after the treatment of PP2A activators in old fish (n = 3 independent biological samples, each group contained two brains; one‐way ANOVA). The IgG assays correspond to controls of the PP2A immunoprecipitation. (b) Experimental design of behavioral tests with 6‐month‐old (adult) and 22‐month‐old (old) WT with or without PP2A activators treatment for 3 days. (c) Experimental scheme for the light–dark transition assay. Parameters recorded and analyzed in light–dark transition assay. (d) Representative diagram of locomotion activity during the 30‐s lights‐on period and 30 s before lights‐on. (e) Quantification of the highly activation state (see Section 4) duration during the 30‐s lights‐on period (n = 8 for 6 m, n = 15 for 22 m, n = 11 for 22m‐MPH, n = 9 for 22m‐DT‐061 and 22m‐FTY720; one‐way ANOVA). (f) Representative movement tracks (gray lines) in the mirror attack assay of adult fish during the 5‐min trial. Blue boxes show the position of the mirror. (g) Mirror attacking latency at indicated time point in 5‐min trail. (Two‐way ANOVA, statistic difference is shown as WT‐6m vs. WT‐22m (black *), WT‐22m vs. WT‐22m‐MPH (red *), WT‐22m vs. WT‐22m‐DT‐061 (blue *), WT‐22m vs. WT‐22m‐FTY720 (orange *)). (h) Quantification of the number of mirror attacks in 5‐min intervals (n = 14 for 6 m, n = 15 for 22 m, n = 12 for 22m‐MPH, n = 9 for 22m‐DT‐061 and 22m‐FTY720; one‐way ANOVA). (i) Representative movement tracks (gray lines) during the 30‐min trial in the open field test. The red box shows the central area of the tank. (j) Central area latency at indicated time point in 30‐min trail. (Two‐way ANOVA, statistic difference are shown as WT‐6m vs. WT‐22m (black *), WT‐22m vs. WT‐22m‐MPH (red *), WT‐22m vs. WT‐22m‐DT‐061 (blue *), WT‐22m vs. WT‐22m‐FTY720 (orange *)). (k) Cumulative time that the adult fish stayed within the central area (n = 16 for 6 m, n = 8 for 22 m, n = 10 for 22m‐MPH, n = 9 for 22m‐DT‐061 and 22m‐FTY720; one‐way ANOVA). Data are means ± SEM. *p < 0.05, **p < 0.01 |
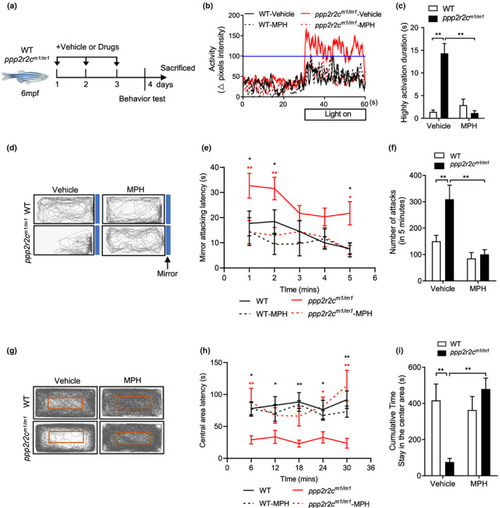
ppp2r2c‐compromised fish exhibit abnormal behaviors that are reversed by MPH. (a) Experimental design. Behavioral tests in WT and ppp2r2c m1/m1 (6 months old) with or without MPH treatment for 3 days. Parameters recorded and analyzed in light–dark transition assay. (b) Representative diagram of locomotion activity of adult fish during the 30‐s lights‐on period and 30 s before lights‐on. (c) Quantification of the highly active state duration during the 30‐s lights‐on period (see Section 4; n = 9 for every group). (d) Representative movement tracks (gray lines) in the mirror attack assay of WT and ppp2r2c m1/m1 (6 months old), with or without MPH treatment for 3 days, during the 5‐min trial. Blue boxes show the position of the mirror. (e) Mirror attacking latency at indicated time point in 5‐min trail. (Statistic difference are shown as WT vs. ppp2r2c m1/m1 (black *), ppp2r2c m1/m1 vs. ppp2r2c m1/m1 ‐MPH (red *)). (f) Quantification of the number of mirror attacks in the 5‐min intervals (n = 9 for WT‐vehicle, WT‐MPH, and ppp2r2c m1/m1 ‐vehicle; n = 8 for ppp2r2c m1/m1 ‐MPH). (g) Representative movement tracks (gray lines) of WT and ppp2r2c m1/m1 (6 months old), with or without MPH treatment for 3 days, during the 30‐min trial in the open field test. The red square shows the central area of the tank. (h) Central area latency at indicated time point in 30‐min trail. (Statistic difference is shown as WT vs. ppp2r2c m1/m1 (black *), ppp2r2c m1/m1 vs. ppp2r2c m1/m1 ‐MPH (red *)). (i) Cumulative time that adult fish stayed within the central area (n = 7 for ppp2r2c m1/m1 ‐vehicle; n = 8 for WT‐vehicle and WT‐MPH; n = 9 for ppp2r2c m1/m1 ‐MPH). Data are means ± SEM. *p < 0.05, **p < 0.01; two‐way ANOVA |
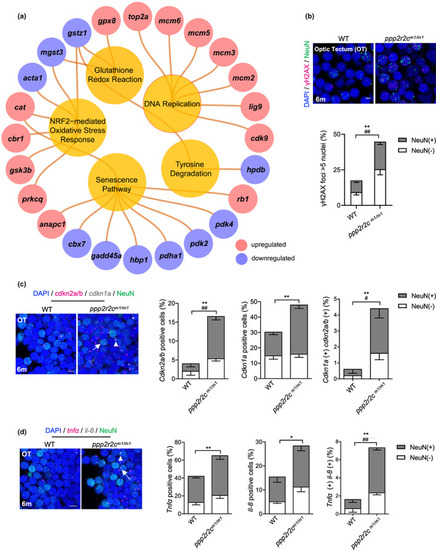
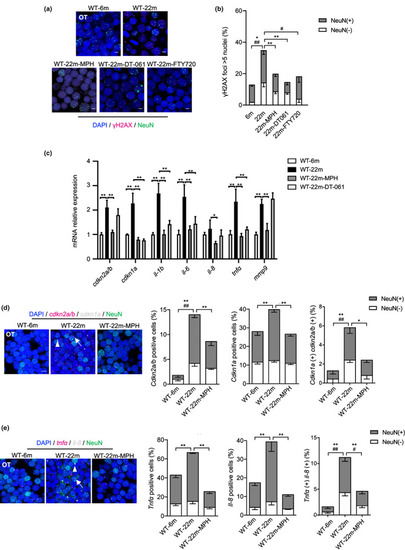
ppp2r2c‐compromised fish exhibit an increased rate of neural cells with senescence markers. (a) Ingenuity pathway analysis of ppp2r2c m1/m1 versus WT brains. Inner circles show selected pathways enriched among the DEGs. Outer circles show upregulated (red) and downregulated (blue) DEGs in ppp2r2c m1/m1 compared with WT brains (n = 3 for every group) (Fisher's exact test, p value <0.0001 for DNA replication; p value <0.01 for the rest pathway). (b) Representative images of confocal section of immunofluorescence showing NeuN (green) co‐staining with γH2AX (magenta) in the OT of WT and ppp2r2c m1/m1 at 6 months old (scale bars, 5 μm). Quantification of γH2AX‐positive (positive values indicate at least five γH2AX foci) neuronal (NeuN+) and non‐neuronal (NeuN−) cells (n = 6 for each group and over 100 nuclei were analyzed per fish; * represents statistical difference in NeuN+ group, # represents statistical difference in NeuN− group). (c) Representative images of confocal section of NeuN (green) co‐staining with cdkn2a/b (magenta) and cdkn1a (gray) mRNA by RNA‐Scope in the OT of WT and ppp2r2c m1/m1 at 6 months old (scale bars, 5 μm). Arrows and triangles point to the cdkn2a/b (magenta) and cdkn1a (grey) mRNA signal, respectively. Quantification of the percentage of cdkn2a/b, cdkn1a positive cells, respectively (positive values indicate at least one mRNA signal), and percentage of double positive cells in neuronal (NeuN+) and non‐neuronal (NeuN−) cells (n = 5 for each group and over 100 nuclei were analyzed per fish; * represents statistical difference in NeuN+ group, # represents statistical difference in NeuN− group). (d) Representative images of confocal section of NeuN (green) co‐staining with tnfa (magenta) and il‐8 (gray) mRNA by RNA‐Scope in the OT of WT and ppp2r2c m1/m1 at 6 months old (scale bars, 5 μm). Arrows and triangles point to the tnfa and il‐8 mRNA signals, respectively. Quantification of the percentage of tnfa, il‐8‐positive cells, respectively (positive values indicate at least one mRNA signal) and percentage of double positive cells in neuronal (NeuN+) and non‐neuronal (NeuN−) cells (n = 5 for each group and over 100 nuclei were analyzed per fish; * represents statistical difference in NeuN+ group, # represents statistical difference in NeuN− group). Data are means ± SEM. *p < 0.05, **p < 0.01, # p < 0.05, ## p < 0.01; unpaired two‐sided t test. |
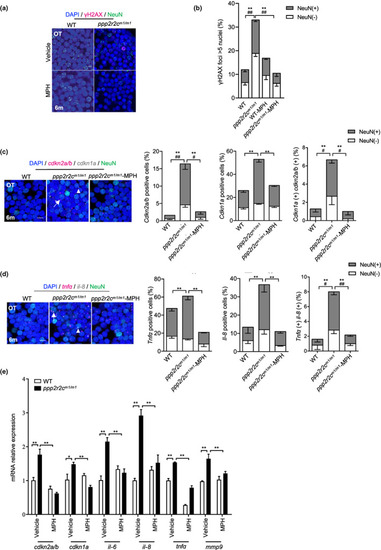
MPH treatment decreases the rate of neural cells with senescence markers in the ppp2r2c‐compromised fish. (a) Immunofluorescence detection of NeuN (green) and γH2AX (magenta) in the OT of WT and ppp2r2c m1/m1 (6‐month‐old) treated with or without MPH for 3 days (scale bars, 5 μm). (b) Quantification shows the percentage of γH2AX positive (positive values indicate at least five γH2AX foci in the nucleus) neuronal (NeuN+) and non‐neuronal (NeuN−) nuclei in (a) (n = 6 brains per group and over 100 nuclei were analyzed per fish; * represents statistical difference in NeuN+ group, # represents statistical difference in NeuN− group; one‐way ANOVA). (c) Representative images of confocal section of NeuN (green) co‐staining with cdkn2a/b (magenta) and cdkn1a (gray) mRNA by RNA‐Scope in the OT of WT and ppp2r2c m1/m1 treated with or without MPH for 3 days at 6 months old (scale bars, 5 μm). Arrows and triangles point to the cdkn2a/b and cdkn1a mRNA signals, respectively. Quantification of the percentage of cdkn2a/b, cdkn1a positive cells, respectively (positive values indicate at least one mRNA signal) and the percentage of double positive cells in neuronal (NeuN+) and non‐neuronal (NeuN−) cells (n = 5 for each group and over 100 nuclei were analyzed per fish; * represents statistical difference in NeuN+ group, # represents statistical difference in NeuN− group; one‐way ANOVA). (d) Representative images of confocal section of NeuN (green) co‐staining with tnfa (magenta) and il‐8 (gray) mRNA by RNA‐Scope in the OT of WT and ppp2r2c m1/m1 treated with or without MPH for 3 days at 6 months old (scale bars, 5 μm). Arrows and triangles point to the tnfa and il‐8 mRNA signals, respectively. Quantification of the percentage of tnfa, il‐8‐positive cells, respectively (positive values indicate at least one mRNA signal) and percentage of double positive cells in neuronal (NeuN+) and non‐neuronal (NeuN−) cells (n = 5 for each group and over 100 nuclei were analyzed per fish; * represents statistical difference in NeuN+ group, # represents statistical difference in NeuN− group; one‐way ANOVA). (e) Relative mRNA expression levels of cdkn1a, cdkn2a/b, and key SASP components determined by RT‐qPCR in WT and ppp2r2c m1/m1 brains with or without MPH treatment (n = 3 independent biological samples, every sample pool two brains; two‐way ANOVA). Data are means ± SEM. **p < 0.01, # p < 0.05, ## p < 0.01 |
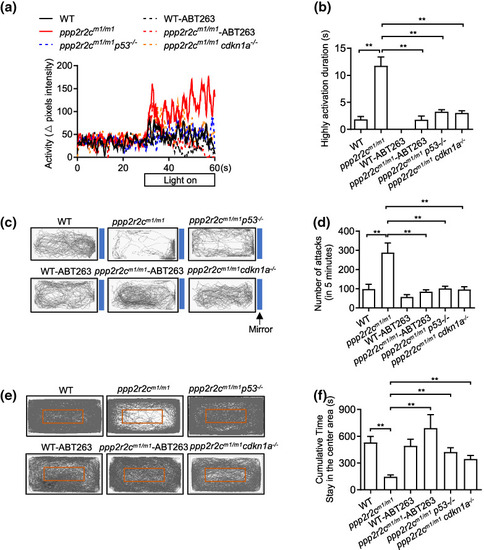
Inhibiting senescence decreases the behavioral disabilities of ppp2r2c‐compromised fish. Behavioral tests of WT and ppp2r2c m1/m1 with or without ABT263 treatment for 3 days, ppp2r2c m1/m1 p53 −/− and ppp2r2c m1/m1 cdkn1a −/− at 6 months old. (a) Representative result from locomotion activity upon light–dark transition assay during the 30‐s lights‐on period and 30 s before lights‐on. (b) Quantification of the highly active state duration during the 30‐s lights‐on period (n = 11 for ppp2r2c m1/m1 p53 −/− ; n = 10 for WT‐vehicle, ppp2r2c m1/m1 ‐vehicle and ppp2r2c m1/m1 cdkn1a −/− groups; n = 9 for WT‐ABT263; n = 8 for ppp2r2c m1/m1 ‐ABT263). (c) Representative movement tracks (gray lines) of WT and ppp2r2c m1/m1 with or without ABT263 treatment for 3 days, ppp2r2c m1/m1 p53 −/− and ppp2r2c m1/m1 cdkn1a −/− in the mirror image attack assay. Blue boxes show the position of the mirror. (d) Quantification of the number of mirror attacks in 5‐min intervals (n = 11 for ppp2r2c m1/m1 p53 −/− ; n = 10 for WT‐vehicle, ppp2r2c m1/m1 ‐vehiclem and ppp2r2c m1/m1 cdkn1a −/− groups; n = 9 for WT‐ABT263 and ppp2r2c m1/m1 ‐ABT263). (e) Representative movement tracks (gray lines) of WT and ppp2r2c m1/m1 with or without ABT263 treatment for 3 days, ppp2r2c m1/m1 p53 −/− and ppp2r2c m1/m1 cdkn1a −/− during a 30‐min trial in the open field test. The red box shows the central area of the tank. (f) Quantification of the cumulative time that fish stayed within the central area (n = 10 for WT‐vehicle, ppp2r2c m1/m1 ‐vehicle, and ppp2r2c m1/m1 cdkn1a −/− groups; n = 9 for WT‐ABT263, ppp2r2c m1/m1 ‐ABT263, and ppp2r2c m1/m1 p53 −/− ). Data are means ± SEM. **p < 0.01; one‐way ANOVA |
PP2A activators decrease the rate of neural cells with senescence markers in old fish. (a) Representative confocal image of NeuN (green) and γH2AX (magenta) co‐staining in the brain of 22‐month‐old fish treated with or without PP2A activators for 3 days (scale bars, 5 μm). (b) Quantification of γH2AX‐positive nuclei (positive values indicate at least five γH2AX foci) in (a) (n = 4 for 6 and 22 m; n = 7 for 22m‐MPH, n = 3 for 22m‐DT‐061 and 22m‐FTY720, over 100 nuclei were analyzed per fish; * represents statistical difference in NeuN+ group, # represents statistical difference in NeuN− group; one‐way ANOVA). (c) Relative mRNA expression levels of cdkn1a, cdkn2a/b, and key SASP components determined by RT‐qPCR in 6 and 22 m WT brains with or without MPH or DT‐061 treatment (n = 3 independent biological samples, every sample pool two brains; one‐way ANOVA). (d) Representative image of confocal section of NeuN (green) co‐staining with cdkn2a/b (magenta) and cdkn1a (gray) mRNA by RNA‐Scope in the OT of 6 and 22 m WT treated with or without MPH for 3 days (scale bars, 5 μm). Arrows and triangles point to the cdkn2a/b and cdkn1a mRNA signals, respectively. Quantification of the percentage of cdkn2a/b, cdkn1a positive cells, respectively (positive values indicate at least one mRNA signal) and percentage of double positive cells in neuronal (NeuN+) and non‐neuronal (NeuN−) cells (n = 5 for each group and over 100 nuclei were analyzed per fish, * represents statistical difference in NeuN+ group, # represents statistical difference in NeuN− group; one‐way ANOVA). (e) Representative images of confocal section of NeuN (green) co‐staining with tnfa (magenta) and il‐8 (gray) mRNA by RNA‐Scope in the OT of 6 and 22 m WT treated with or without MPH for 3 days (scale bars, 5 μm). Arrows and triangles point to the tnfa and il‐8 mRNA signals, respectively. Quantification of the percentage of tnfa, il‐8‐positive cells, respectively (positive values indicate at least one mRNA signal) and percentage of double positive cells in neuronal (NeuN+) and non‐neuronal (NeuN−) cells (n = 5 for each group and over 100 nuclei were analyzed per fish; * represents statistical difference in NeuN+ group, # represents statistical difference in NeuN− group; one‐way ANOVA). Data are shown in means ± SEM. *p < 0.05, **p < 0.01, # p < 0.05, ## p < 0.01 |
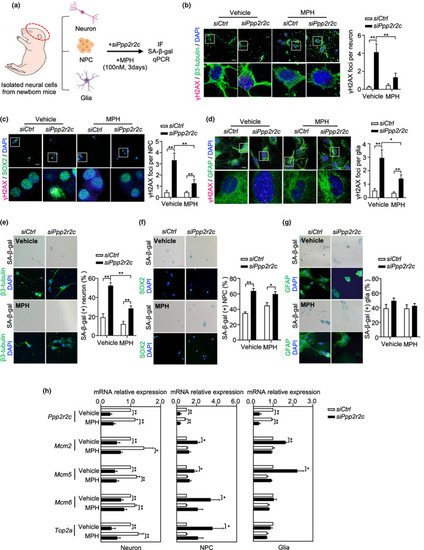
MPH attenuates H2AX phosphorylation induced by ppp2r2c knockdown in mice primary neural cells. (a) Experimental design for MPH treatment of ppp2r2c knockdown in isolated primary neural cells from newborn mice. (b–d) Representative confocal images and relevant quantification of γH2AX foci (magenta) in primary neurons (stained with β‐tubulin, green), neural progenitor cells (NPCs, stained with SOX2, green), and glial cells (stained with GFAP, green) that were dissected from new born mice and cultured for 1 week and then were transfected with siRNA and treated with or without MPH for 3 days (scale bars, 15 μm). White boxes indicate the enlarged regions (n = 3 independent experiments for neurons, n = 2 independent experiments for NPCs and glial cells, above five fields containing at least 100 cells were analyzed per condition; two‐way ANOVA). (e–g) Representative microscopy images and its quantification of SA‐β‐gal signals in primary neurons (stained with β‐tubulin, green), NPCs (stained with SOX2, green), and glial (stained with GFAP, green) cells (scale bars, 25 μm for neuron, 50 μm for NPCs and glial cells). Quantification analysis of percentage of SA‐β‐gal‐positive cells (n = 3 independent experiments for neurons, n = 2 independent experiments for NPCs and glial cells, more than 100 cells were analyzed per condition; two‐way ANOVA). (h) Relative mRNA expression levels of Ppp2r2c, Mcm2, Mcm5, Mcm6, and Top2a in primary mouse neurons, NPCs, and glial cells determined by RT‐qPCR (n = 5 independent experiments for neurons and NPCs; n = 3 independent experiments for glial cells; unpaired two‐sided t test). Data are means ± SEM. *p < 0.05, **p < 0.01 |