
FIGURE 4
- ID
- ZDB-FIG-230315-63
- Publication
- Xing et al., 2023 - Protein phosphatase 2A activators reverse age-related behavioral changes by targeting neural cell senescence
- Other Figures
- All Figure Page
- Back to All Figure Page
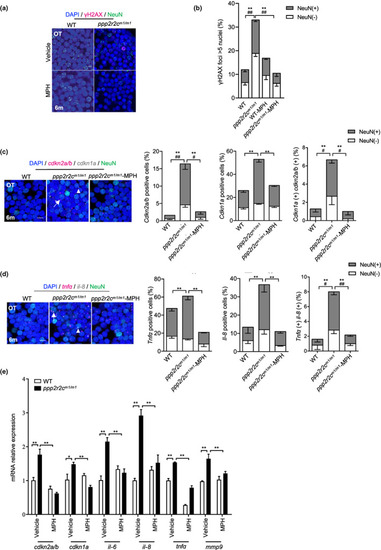
MPH treatment decreases the rate of neural cells with senescence markers in the ppp2r2c‐compromised fish. (a) Immunofluorescence detection of NeuN (green) and γH2AX (magenta) in the OT of WT and ppp2r2c m1/m1 (6‐month‐old) treated with or without MPH for 3 days (scale bars, 5 μm). (b) Quantification shows the percentage of γH2AX positive (positive values indicate at least five γH2AX foci in the nucleus) neuronal (NeuN+) and non‐neuronal (NeuN−) nuclei in (a) (n = 6 brains per group and over 100 nuclei were analyzed per fish; * represents statistical difference in NeuN+ group, # represents statistical difference in NeuN− group; one‐way ANOVA). (c) Representative images of confocal section of NeuN (green) co‐staining with cdkn2a/b (magenta) and cdkn1a (gray) mRNA by RNA‐Scope in the OT of WT and ppp2r2c m1/m1 treated with or without MPH for 3 days at 6 months old (scale bars, 5 μm). Arrows and triangles point to the cdkn2a/b and cdkn1a mRNA signals, respectively. Quantification of the percentage of cdkn2a/b, cdkn1a positive cells, respectively (positive values indicate at least one mRNA signal) and the percentage of double positive cells in neuronal (NeuN+) and non‐neuronal (NeuN−) cells (n = 5 for each group and over 100 nuclei were analyzed per fish; * represents statistical difference in NeuN+ group, # represents statistical difference in NeuN− group; one‐way ANOVA). (d) Representative images of confocal section of NeuN (green) co‐staining with tnfa (magenta) and il‐8 (gray) mRNA by RNA‐Scope in the OT of WT and ppp2r2c m1/m1 treated with or without MPH for 3 days at 6 months old (scale bars, 5 μm). Arrows and triangles point to the tnfa and il‐8 mRNA signals, respectively. Quantification of the percentage of tnfa, il‐8‐positive cells, respectively (positive values indicate at least one mRNA signal) and percentage of double positive cells in neuronal (NeuN+) and non‐neuronal (NeuN−) cells (n = 5 for each group and over 100 nuclei were analyzed per fish; * represents statistical difference in NeuN+ group, # represents statistical difference in NeuN− group; one‐way ANOVA). (e) Relative mRNA expression levels of cdkn1a, cdkn2a/b, and key SASP components determined by RT‐qPCR in WT and ppp2r2c m1/m1 brains with or without MPH treatment (n = 3 independent biological samples, every sample pool two brains; two‐way ANOVA). Data are means ± SEM. **p < 0.01, # p < 0.05, ## p < 0.01 |