
|
FIGURE 5
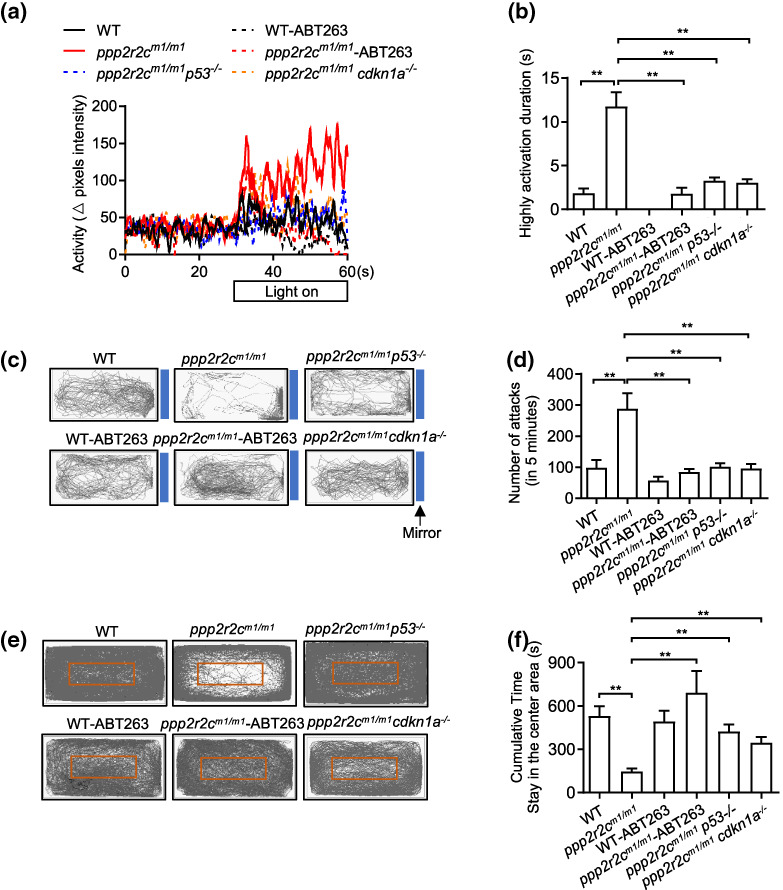
Inhibiting senescence decreases the behavioral disabilities of ppp2r2c‐compromised fish. Behavioral tests of WT and ppp2r2c m1/m1 with or without ABT263 treatment for 3 days, ppp2r2c m1/m1 p53 −/− and ppp2r2c m1/m1 cdkn1a −/− at 6 months old. (a) Representative result from locomotion activity upon light–dark transition assay during the 30‐s lights‐on period and 30 s before lights‐on. (b) Quantification of the highly active state duration during the 30‐s lights‐on period (n = 11 for ppp2r2c m1/m1 p53 −/− ; n = 10 for WT‐vehicle, ppp2r2c m1/m1 ‐vehicle and ppp2r2c m1/m1 cdkn1a −/− groups; n = 9 for WT‐ABT263; n = 8 for ppp2r2c m1/m1 ‐ABT263). (c) Representative movement tracks (gray lines) of WT and ppp2r2c m1/m1 with or without ABT263 treatment for 3 days, ppp2r2c m1/m1 p53 −/− and ppp2r2c m1/m1 cdkn1a −/− in the mirror image attack assay. Blue boxes show the position of the mirror. (d) Quantification of the number of mirror attacks in 5‐min intervals (n = 11 for ppp2r2c m1/m1 p53 −/− ; n = 10 for WT‐vehicle, ppp2r2c m1/m1 ‐vehiclem and ppp2r2c m1/m1 cdkn1a −/− groups; n = 9 for WT‐ABT263 and ppp2r2c m1/m1 ‐ABT263). (e) Representative movement tracks (gray lines) of WT and ppp2r2c m1/m1 with or without ABT263 treatment for 3 days, ppp2r2c m1/m1 p53 −/− and ppp2r2c m1/m1 cdkn1a −/− during a 30‐min trial in the open field test. The red box shows the central area of the tank. (f) Quantification of the cumulative time that fish stayed within the central area (n = 10 for WT‐vehicle, ppp2r2c m1/m1 ‐vehicle, and ppp2r2c m1/m1 cdkn1a −/− groups; n = 9 for WT‐ABT263, ppp2r2c m1/m1 ‐ABT263, and ppp2r2c m1/m1 p53 −/− ). Data are means ± SEM. **p < 0.01; one‐way ANOVA