
|
FIGURE 3
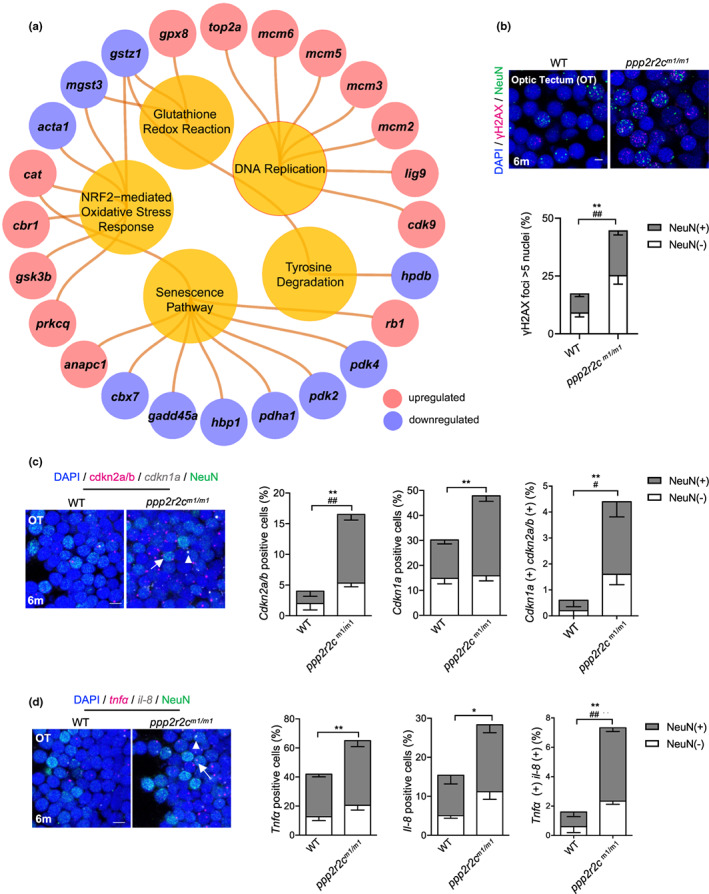
ppp2r2c‐compromised fish exhibit an increased rate of neural cells with senescence markers. (a) Ingenuity pathway analysis of ppp2r2c m1/m1 versus WT brains. Inner circles show selected pathways enriched among the DEGs. Outer circles show upregulated (red) and downregulated (blue) DEGs in ppp2r2c m1/m1 compared with WT brains (n = 3 for every group) (Fisher's exact test, p value <0.0001 for DNA replication; p value <0.01 for the rest pathway). (b) Representative images of confocal section of immunofluorescence showing NeuN (green) co‐staining with γH2AX (magenta) in the OT of WT and ppp2r2c m1/m1 at 6 months old (scale bars, 5 μm). Quantification of γH2AX‐positive (positive values indicate at least five γH2AX foci) neuronal (NeuN+) and non‐neuronal (NeuN−) cells (n = 6 for each group and over 100 nuclei were analyzed per fish; * represents statistical difference in NeuN+ group, # represents statistical difference in NeuN− group). (c) Representative images of confocal section of NeuN (green) co‐staining with cdkn2a/b (magenta) and cdkn1a (gray) mRNA by RNA‐Scope in the OT of WT and ppp2r2c m1/m1 at 6 months old (scale bars, 5 μm). Arrows and triangles point to the cdkn2a/b (magenta) and cdkn1a (grey) mRNA signal, respectively. Quantification of the percentage of cdkn2a/b, cdkn1a positive cells, respectively (positive values indicate at least one mRNA signal), and percentage of double positive cells in neuronal (NeuN+) and non‐neuronal (NeuN−) cells (n = 5 for each group and over 100 nuclei were analyzed per fish; * represents statistical difference in NeuN+ group, # represents statistical difference in NeuN− group). (d) Representative images of confocal section of NeuN (green) co‐staining with tnfa (magenta) and il‐8 (gray) mRNA by RNA‐Scope in the OT of WT and ppp2r2c m1/m1 at 6 months old (scale bars, 5 μm). Arrows and triangles point to the tnfa and il‐8 mRNA signals, respectively. Quantification of the percentage of tnfa, il‐8‐positive cells, respectively (positive values indicate at least one mRNA signal) and percentage of double positive cells in neuronal (NeuN+) and non‐neuronal (NeuN−) cells (n = 5 for each group and over 100 nuclei were analyzed per fish; * represents statistical difference in NeuN+ group, # represents statistical difference in NeuN− group). Data are means ± SEM. *p < 0.05, **p < 0.01, # p < 0.05, ## p < 0.01; unpaired two‐sided t test.