
- Title
-
Splashed E-box and AP-1 motifs cooperatively drive regeneration response and shape regeneration abilities
- Authors
- Tamaki, T., Yoshida, T., Shibata, E., Nishihara, H., Ochi, H., Kawakami, A.
- Source
- Full text @ Biol. Open
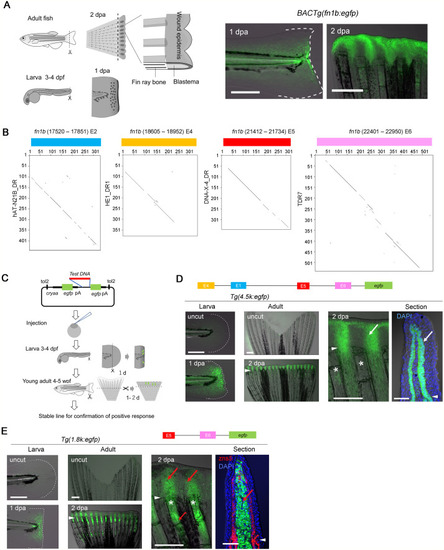
Regeneration-dependent response of the fn1b promoter. (A) Regeneration of adult fish fin and larval fin fold, and amputation-induced EGFP expression in the Tg(fn1b:egfp). (B) Harr-plot analysis of E2, E4, E5, and E6 with the TEs, hAT-N21B_DR, HE1_DR1, DNA-X-4_DR, and TDR7, respectively. (C) Procedure of transgenic EGFP reporter assay. (D,E) EGFP induction in the larval fin fold (left) and adult fin (middle and right) of respective Tgs. n=2 Tg lines. Right panels, higher magnification of adult fin. zns5, osteoblasts. EGFP expression was induced in the WE (D) and blastema (E), but no detectable EGFP expression was observed in other tissues. Arrowhead, amputation plane; *, fin ray; white arrows, EGFP in the basal epidermis; red arrows, EGFP in the fin ray mesenchyme and blastema. Scale bars: 50 µm (left panels), 500 µm (middle panels), and 100 µm (sections). |
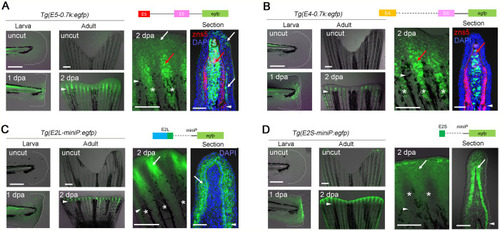
RRE activities in TEs and non-TE sequences. (A–D) EGFP induction in the larval fin fold (left) and adult fin (middle and right) of respective Tgs. Right panels, higher magnification of the adult fin. zns5, osteoblasts. n=2 Tg lines. EGFP expression was mostly induced in the blastema (A,B) and in the WE (C,D), but not observed in other tissues. Arrowhead, amputation plane; *, fin ray; white arrows, EGFP in the basal epidermis; red arrows, EGFP in the fin-ray mesenchyme and blastema. Scale bars: 50 µm (left panels), 500 µm (middle panels), and 100 µm (sections). |

Combination of E-box and AP-1 motifs acts as the RRE. (A,B) Alignment of E-box (A) and AP-1 (B) motifs in the respective RREs. TRE, a consensus 12-O-tetradecanoylphorbol-13-acetate responsive element. The motifs with scores≥10.0 are shown. (C,D) Distribution of the E-box and AP-1 motifs in the previously reported RREs. Numbers, the Jaspar scores. Green boxes, regions homologous to TEs. (E) EGFP induction in the larval fin fold (left panels) and adult fin (right panels) of the Tg(6×E-0.7k:egfp) (n=3 Tg lines). (F) EGFP induction of Tg(6×E-0.7k:egfp) at different regeneration stages. zns5, osteoblasts. EGFP induction is seen in the distal WE and the fin ray mesenchymes that give rise to the blastema. (G) EGFP induction in the larval fin fold (left) and adult fin (right) of Tg(6×E-6×A:egfp) (n=2 Tg lines). (H) EGFP induction of Tg(6×E-6×A:egfp) at different regeneration stages. Arrowheads, amputation plane. *, fin ray; white arrows, EGFP in the basal epidermis; red arrows, EGFP in the fin ray mesenchyme and blastema. Scale bars: 50 µm (larvae), 500 µm (adult fin), and 100 µm (adult fin section). In all Tgs, EGFP expression was not detected in other body regions. |

Conservation of E-box/AP-1-mediated regeneration response beyond tissue types and species. (A) EGFP induction by ray injury, but not by inter-ray incision in Tg(E2L:egfp) (upper) and Tg(E4-0.7k:egfp) (lower). EGFP induction was prominently detected on the proximal side of the injury. Arrow, site of inter-ray injury. Scale bar: 500 µm. (B) EGFP induction after heart resection in Tg(1.8k:egfp) (upper) and Tg(fn1b:egfp) (lower). MF20, cardiac muscles. Tg(1.8k:egfp) showed EGFP induction in the cardiomyocytes around amputation (n=5 for uninjured and injured fish). In Tg(fn1b:EGFP), EGFP expression in the epicardial cells can be observed in the uncut heart (n=3 fish), but it was upregulated by heart resection (n=3 fish). Dotted line, amputation site. Scale bar: 200 µm. (C) EGFP induction in the amputated limb bud of X. laevis injected with respective constructs at the one-cell stage. Arrows, EGFP expression; dotted lines, site of amputation. EGFP induction was observed in mesenchymal cells (1.8k:egfp, n=12 of 12 with lens EGFP+ tadpoles) and the distal tip of epithelial cells (6xE-0.7k:egfp, n=8 of 8 with lens EGFP+ tadpole). Scale bar: 1 mm. (D) Knockdown of the EGFP induction by the JNK inhibitor, SP600125, in Tg(E2L:egfp) (n =10) and Tg(E4-0.7k:egfp) (n =10). Dotted lines, amputation plane; brackets, cells forming the WE (upper panel) and blastema (lower panel). Scale bar: 0.5 mm. (E) Quantification of EGFP fluorescence in (D). Data are presented as mean ±s.e.m. Student's t-test. ***P<0.001. (F) dnLef1 construct and the experimental procedure. (G) Knockdown of EGFP induction by dnLef1 overexpression in Tg(E2L:egfp) (n=5) and Tg(E4-0.7k:egf) (n=12). Dotted lines, amputation plane; brackets, cells forming the WE (upper panel) and blastema (lower panel). Scale bar: 0.5 mm. (H) Quantification of EGFP fluorescence in G. Data are presented as mean ±s.e.m. Student's t-test. ***P<0.001. |