
- Title
-
Kindlin2 enables EphB/ephrinB bi-directional signaling to support vascular development
- Authors
- Li, W., Wen, L., Rathod, B., Gingras, A.C., Ley, K., Lee, H.S.
- Source
- Full text @ Life Sci Alliance
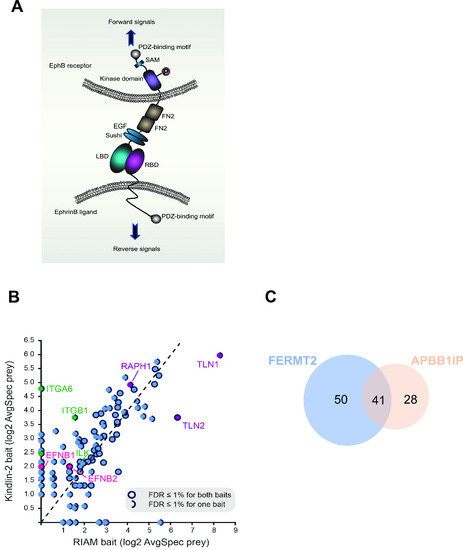
BioID of kindlin2 and RIAM baits.
(A) Domain structure and bi-directional signaling of ephrinB and EphB. EphB receptors and ephrinBs located at the cell membrane of opposing cells interact in trans and activate short-distance bi-directional signaling. LBD, ligand-binding domain; RBD, receptor-binding domain; FN, fibronectin domain; EGF, epidermal growth factor–like domain; SAM, sterile alpha motif. Orange circle indicates tyrosine phosphorylation. (B) Scatterplot comparing the averaged spectra (log2-transformed) for high-confidence preys identified from kindlin2 with RIAM baits; notable preys are indicated and filled in different colors, with details in the legend inset. (C) Venn diagram showing the number of overlapped preys discovered in the proximity interactomes of kindlin2 and RIAM baits. All high-confidence interactions (AvgP ≥ 0.95) for each bait were considered. See Fig S1 for details. |

Kindlin2 binds NxxY motif in the ephrinB2 cytoplasmic tail.
(A) Cytoplasmic tail sequence alignment compares ephrinB2 with integrins β1 and β3 (upper panel). Membrane-proximal NPxY motif in integrins β1 and β3 is bolded. Serine/threonine residues are bolded and underlined. NxxY motif is bolded and boxed, and ephrinB2 PDZ-binding motif is underlined. Conservation of ephrinB2 Ser/Thr residue and NxxY motif in human, mouse, and zebrafish was examined using Clustal Omega program (http://www.ebi.ac.uk/Tools/msa/clustalo/) (lower panel). “*” indicates fully conserved amino acid residue. (B) Pulldown assay using purified his/Avi-tagged cytoplasmic tails of ephrinB2 WT, kindlin2-binding mutant 4A (NxxY to four alanine mutants), and integrin β1A or αIIb immobilized on NeutrAvidin beads was performed with a cell lysate expressing GFP-kindlin2. Bound proteins were washed and separated on SDS–PAGE, and binding of kindlin2 was detected by Western blot with anti-GFP antibody. Immobilized cytoplasmic tails were visualized by Coomassie brilliant blue staining. Both WT and 4A mutant were expressed equally well. (C) Pulldown assay of his/Avi-tagged cytoplasmic tails of ephrinB2 WT, 4A, or integrin αIIb immobilized on NeutrAvidin beads with a cell lysate expressing GFP-Dvl2. Associated proteins were subjected to SDS–PAGE and subsequent Western blotting. Dvl2 was recognized by an anti-GFP antibody. Immobilized cytoplasmic tails were stained by Coomassie brilliant blue. (D) In vitro binding assay mapping the kindlin2-binding site on the ephrinB2 cytoplasmic tail. Purified kindlin2 was mixed with cytoplasmic tails of ephrinB2 WT, kindlin2-binding mutant (4A), or integrin αIIb immobilized on NeutrAvidin beads and assessed for binding. Anti-kindlin2 antibody was used to detect bound kindlin2 in Western blot, and cytoplasmic tails were stained by Coomassie brilliant blue. (E) In vitro binding assay between purified kindlin2 and cytoplasmic tails of ephrinB2 with mutations of critical residues in NxxY motif and upstream serine residue immobilized on NeutrAvidin beads (left panel). The mutated residues were indicated in the ephrinB2 cytoplasmic tail sequence (right panel). Bound kindlin2 was recognized by anti-kindlin2 antibody in Western blot, and cytoplasmic tails were detected by Coomassie brilliant blue. (F) Binding of kindlin2 was quantified by densitometry, normalized to cytoplasmic tail loading, and then calculated relative to the binding of ephrinB2 WT (means ± SEM; n = 3). (G) Pulldown analysis of his/Avi-tagged cytoplasmic tails of ephrinB2 WT or 4A as a negative control, immobilized on NeutrAvidin beads with a cell lysate expressing GFP-kindlin2 WT or W615A, respectively. Bound proteins were fractionated on SDS–PAGE and probed with an anti-GFP antibody in Western blot. Immobilized cytoplasmic tails were visualized by Coomassie brilliant blue staining. (H) Pulldown of his/Avi-tagged cytoplasmic tails of integrin β1A or αIIb on NeutrAvidin beads with a cell lysate expressing GFP-kindlin2 WT or W615A, respectively. Pulldown proteins were washed and separated on SDS–PAGE. GFP-kindlin2 was recognized by anti-GFP antibody in Western blot. Purified cytoplasmic tails on NeutrAvidin beads were visualized by Coomassie brilliant blue staining. (I) His/Avi-tagged cytoplasmic tails of ephrinB1, ephrinB3, and integrin β1 or αIIb immobilized on NeutrAvidin beads were mixed with a cell lysate expressing GFP-kindlin2. The pulldown results were visualized by SDS–PAGE and Western blotting with anti-GFP antibody. All mutants were expressed equally well as WT. (J) Protein alignment (right panel) of cytoplasmic domains ephrinB1, ephrinB2, and ephrinB3 was generated by Clustal Omega. “*” denotes fully conserved amino acid residue, and “:” indicates conserved residue with similar properties among ephrinB cytoplasmic tails. (K) Pulldown of kindlin3 with his/Avi-tagged cytoplasmic tails of ephrinB2 WT, 4A, and integrin β1A or αIIb immobilized on NeutrAvidin beads. Bound proteins were separated on SDS–PAGE. Cytoplasmic tails were stained by Coomassie brilliant blue staining, and kindlin3 was probed by anti-GFP antibody in Western blot. Source data are available for this figure. |
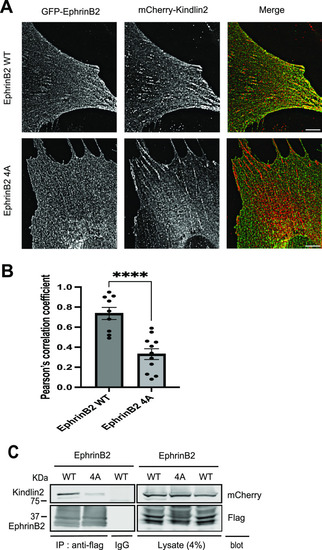
Kindlin2 and ephrinB2 are associated in mammalian cells.
(A) Kindlin2 co-localizes with ephrinB2 in adhesive structures. NIH3T3 cells were co-transduced by lentivirus particles expressing mCherry-kindlin2 with GFP-ephrinB2 WT or 4A, respectively. The cells were plated on laminin-coated wells. Localization of the two proteins was visualized by an TIRF microscope. Scale bar, 6 µm. (B) Co-localization of kindlin2 with ephrinB2 WT or 4A was measured as the mean values of Pearson’s correlation coefficient on TIRF images. EphrinB2 WT, n = 9; EphrinB2 4A, n = 11. The data are presented as the mean ± SEM. Statistical analysis used an unpaired two-tailed t test. ****P < 0.0001. (C) mCherry-kindlin2 was co-transfected into HEK293 cells with flag-ephrinB2, flag-ephrinB2 (4A), or flag-integrin β1 as a positive control. The cells were lysed, and flag-tagged proteins were immunoprecipitated by anti-flag antibody or control IgG as a negative control. The immunocomplexes were washed and separated on SDS–PAGE. Associated kindlin2 was recognized by anti-mCherry antibody in Western blot. All proteins were expressed equally well. Source data are available for this figure. |
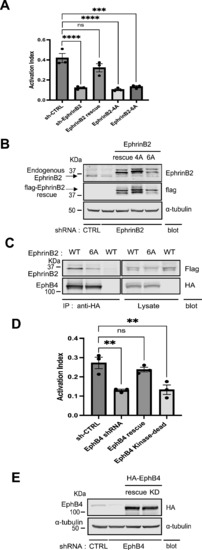
EphrinB2 and EphB4 regulate integrin signaling.
(A) Silencing ephrinB2 expression resulted in integrin activation defect. The expression of endogenous ephrinB2 was silenced by lentivirus-based RNAi in 293 cells expressing constitutively active αIIb(R995A)β3. A scrambled shRNA was used as a negative control. (C) For rescue experiment, cells were transiently transfected with cDNAs encoding empty vector, shRNA-resistant ephrinB2, ephrinB2 (4A), or ephrinB2 (6A, EphB4-binding mutant, shown in (C)), respectively. The binding of PAC1 (activation-specific anti-αIIbβ3 monoclonal antibody) was assessed by FACS analysis. The activation index of transfected cells was calculated as (F - Fo)/(Fm - Fo), in which F is the median fluorescence intensity (MFI) of PAC1 binding; Fo is the MFI of PAC1 binding in the presence of competitive inhibitor (Integrilin, 1 µM); and Fm is the MFI of PAC1 binding in the presence of the integrin-activating antibody anti-LIBS6 (2 µM). Results represent the mean ± SEM (n = 3) (**P < 0.01; one-way ANOVA) (left panel). (B) Expression of ephrinB2 and its mutants was confirmed by immunoblotting of SDS–PAGE-fractionated cell lysates. (C) Co-IP of EphB4 and ephrinB2. Cell lysates were produced from cells co-transfected with HA-EphB4 and flag-ephrinB2 WT or 6A and immunoprecipitated by anti-HA antibody. Captured immunocomplex was washed and separated on SDS–PAGE. Bound ephrinB2 was recognized in Western blot with anti-flag antibody. HA-EphB4 and flag-EphrinB2 WT or 6A were expressed equally well. (D) Knockdown of EphB4 expression caused a defect in integrin activation. Endogenous EphB4 expression was reduced by lentivirus shRNA in the 293(αIIb[R995A]β3) cells. And the cells were transiently transfected with cDNAs encoding empty vector, shRNA-resistant EphB4, or EphB4 kinase-dead mutant, respectively. Integrin activation was assessed by PAC1 (activation-specific anti-αIIbβ3 monoclonal antibody) on FACS analysis. (A) Activation index of transfected cells was calculated as in (A). Results represent the mean ± SEM (n = 3) (**P < 0.01; one-way ANOVA). (E) Expression of EphB4 and its mutants was verified by Western blotting of SDS–PAGE-fractionated cell lysates. Source data are available for this figure. |
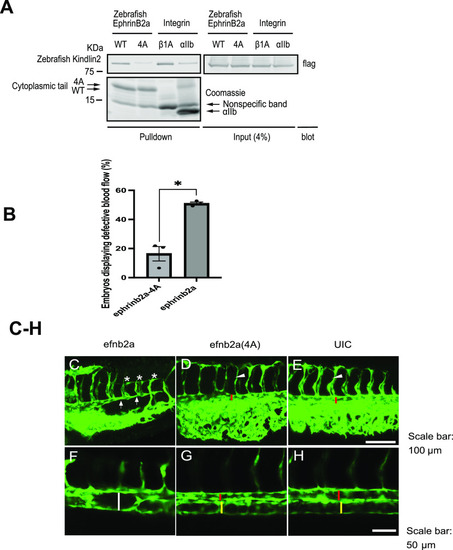
Perturbation of kindlin2 binding to ephrinB2 causes defects in vascular development in zebrafish.
(A) Pulldown experiment using cytoplasmic tails of zebrafish ephrinB2, ephrinB2 (4A), and integrin β1A or αIIb immobilized on NeutrAvidin beads with a cell lysate expressing GFP-zebrafish kindlin2. Bound proteins were fractionated on SDS–PAGE. His/Avi-tagged cytoplasmic tails were stained by Coomassie blue, and kindlin2 was recognized by Western blotting with anti-GFP antibody. Asterisk indicates the position of purified his/Avi-tagged cytoplasmic tails. (B) Percentage of zebrafish embryos injected with efnb2a WT or 4A RNAs displaying defects in blood flow. The data are presented as the mean ± SEM (n = 3). An unpaired two-tailed t test was used. **P < 0.01. (C, D, E) Some zebrafish embryos that overexpressed ephrinb2a displayed extremely narrow dorsal aorta (indicated by arrow) and inadequate intersegmental vessel growth (indicated by star), whereas embryos that overexpressed 4A mutant of ephrinb2a (D) and uninjected embryos (UIC) (E) did not show these defects (red bar indicated the 10 aorta, and arrowhead indicated the intersegmental vessel). (F, G, H) Other zebrafish embryos that overexpressed ephrinb2a failed the arterial/venous segregation (indicated by white bar) in local area of the trunk, whereas this defect was not seen in 4A-overexpressed embryos (G) and uninjected embryos (UIC) (H) (red and yellow bars indicated the dorsal aorta and posterior cardinal vein, respectively). Scale bar, 100 µm (C, D, E) and 50 μm (F, G, H). Source data are available for this figure. |

Kindlin2 binding to the ephrinB2 cytoplasmic tail transduces EphB4-ephrinB2 forward signaling.
(A) Cartoon schematics of two cell populations to assess EphB4 forward signaling. We used BT16 cells that do not express endogenous ephrinB2 for the assay, and kindlin2 is a major kindlin isoform (Fig S4 and https://depmap.org). Stable BT16 cells expressing exogenous flag-ephrinB2 and HEK293 cells expressing HA-EphB4 were generated by lentivirus-mediated gene integration, respectively. The two cell populations were harvested and combined for 2 h. Cell lysates were produced and immunoprecipitated with anti-HA antibody. Bound immunocomplex was separated on SDS–PAGE, and tyrosine phosphorylation of EphB4 was assessed by Western blotting with anti-phosphotyrosine–specific antibody. Cell lysate immunoprecipitated by normal IgG was used as a negative control. (B) Kindlin2 binding to the ephrinB2 cytoplasmic tail in BT16 cells regulates in trans EphB4 activation in HEK293 cells. BT16 stable cells expressing flag-ephrinB2 WT or 4A are incubated with HEK293 stable cells expressing HA-EphB4. Cells were lysed, and EphB4/ephrinB2 complex in cell lysates was immunoprecipitated by anti-HA antibody. And bound EphB4 and EphrinB2 were recognized with anti-HA and anti-flag antibodies in Western blot, respectively. The status of tyrosine phosphorylation of EphB4 was analyzed by anti-phosphotyrosine–specific antibody. (C) Ratio of tyrosine-phosphorylated EphB4 to total EphB4 was determined by densitometry in Western blot. The data are shown as the mean ± SEM (n = 3). A one-sample t test was used. **P < 0.01. (D) Cartoon showing disrupting kindlin2 binding to the ephrinB2 cytoplasmic tail in BT16 cells decreases EphB4 activation in HEK293 cells. (E) Silencing kindlin2 expression in BT16 cells reduces EphB4 activation in HEK293 cells. (F) Endogenous kindlin2 expression in BT16 cells expressing flag-ephrinB2 was silenced by shRNA (F) and co-cultured with HEK293 cells expressing HA-EphB4. Cell lysates were produced and immunoprecipitated by anti-HA antibody to isolate EphB4/ephrinB2 complex. Captured proteins were fractionated on SDS–PAGE and analyzed by Western blot with anti-phosphotyrosine, anti-HA, and anti-flag antibodies, respectively. (G) Tyrosine-phosphorylated EphB4/total EphB4 ratio was assessed by densitometry in Western blot. The data are evaluated as the mean ± SEM (n = 3). A one-sample t test was used. **P < 0.01. (H) Cartoon illustrates that silencing kindlin2 expression in BT16 cells diminishes EphB4 activation in HEK293 cells. (I) Silencing integrin expression in HEK293 cells decreases kindlin2-dependent EphB4 activation. (J) BT16 stable cells were co-cultured with HEK293 stable cells that were treated with integrin β1 shRNA to knock down endogenous integrin β1 expression (J). After cells were lysed, EphB4/ephrinB2 complex was immunoprecipitated by anti-HA antibody and the status of EphB4 phosphorylation was assessed by anti-phosphotyrosine antibody. (K) Tyrosine phosphorylation status of EphB4 was measured by scanning band intensity in Western blot. Bar graph shows the mean ± SEM (n = 3). A one-sample t test was used. **P < 0.01. (L) Cartoon displays that repressing endogenous integrin β1 expression in HEK293 cells decreases kindlin2-mediated EphB4 activation. (M) Kindlin2 regulates EphB2/ephrinB1 forward signaling. BT16 stable cells expressing flag-ephrinB1 were incubated with HEK293 stable cells expressing HA-EphB2. Cell lysates were produced, and EphB2/ephrinB1 complex was immunoprecipitated by anti-HA antibody. And immunoprecipitated proteins were analyzed for the activation status of EphB2 by Western blotting with anti-phosphotyrosine antibody. (N) Quantified band intensities are displayed as phosphoEphB4/total EphB4 ratio. The data are presented as the mean ± SEM (n = 3). Statistical analysis used a one-sample t test. ***P < 0.001. (O) Cartoon illustrating that disrupting kindlin2 binding to ephrinB1 diminishes EphB2 activation in HEK293 cells. Source data are available for this figure. |

Kindlin2 promotes ephrinB2 clustering and cell adhesion.
(A) TIRF and epifluorescence images showing the cluster formation of GFP-ephrinB2 WT or 4A. BT16 cells were transduced with lentivirus particles expressing GFP-ephrinB2 WT or 4A and plated on EphB4-Fc + laminin-coated well for 2 h. Scale bar, 5 µm. (B) Fluorescence intensities of ephrinB2 clusters were measured and averaged as described in Experimental Procedures. Error bars indicate the SEM of ephrinB2, n = 24; ephrinB2-4A, n = 16. The data are presented as the mean ± SEM. An unpaired two-tailed t test was used. *P < 0.05. (C) TIRF and epifluorescence images showing the cluster formation of GFP-ephrinB2 WT or 4A. BT16 cells were transduced with lentivirus particles expressing GFP-ephrinB2 WT or 4A and plated only on EphB4-Fc–coated well for 2 h. Scale bar, 5 µm. (D) Cell culture plates were coated with EphB4-Fc (5 µg/ml), and the free protein-binding sites were blocked with BSA. After cells were plated and incubated for the indicated times, the plates were washed, and quantitative cell adhesion assays were performed as described in Experimental Procedures. (E) Total protein expression of GFP-ephrinB2 WT or 4A in BT16 cells was verified by SDS–PAGE of a cell lysate followed by Western blot with anti-GFP antibody. (F) Cell surface protein expression on BT16 cells expressing GFP-ephrinB2 WT, 4A, or uninfected control was confirmed by flow cytometric analysis. Cells were harvested and stained with anti-GFP antibody and Alexa Fluor 647–conjugated secondary antibody. Source data are available for this figure. |