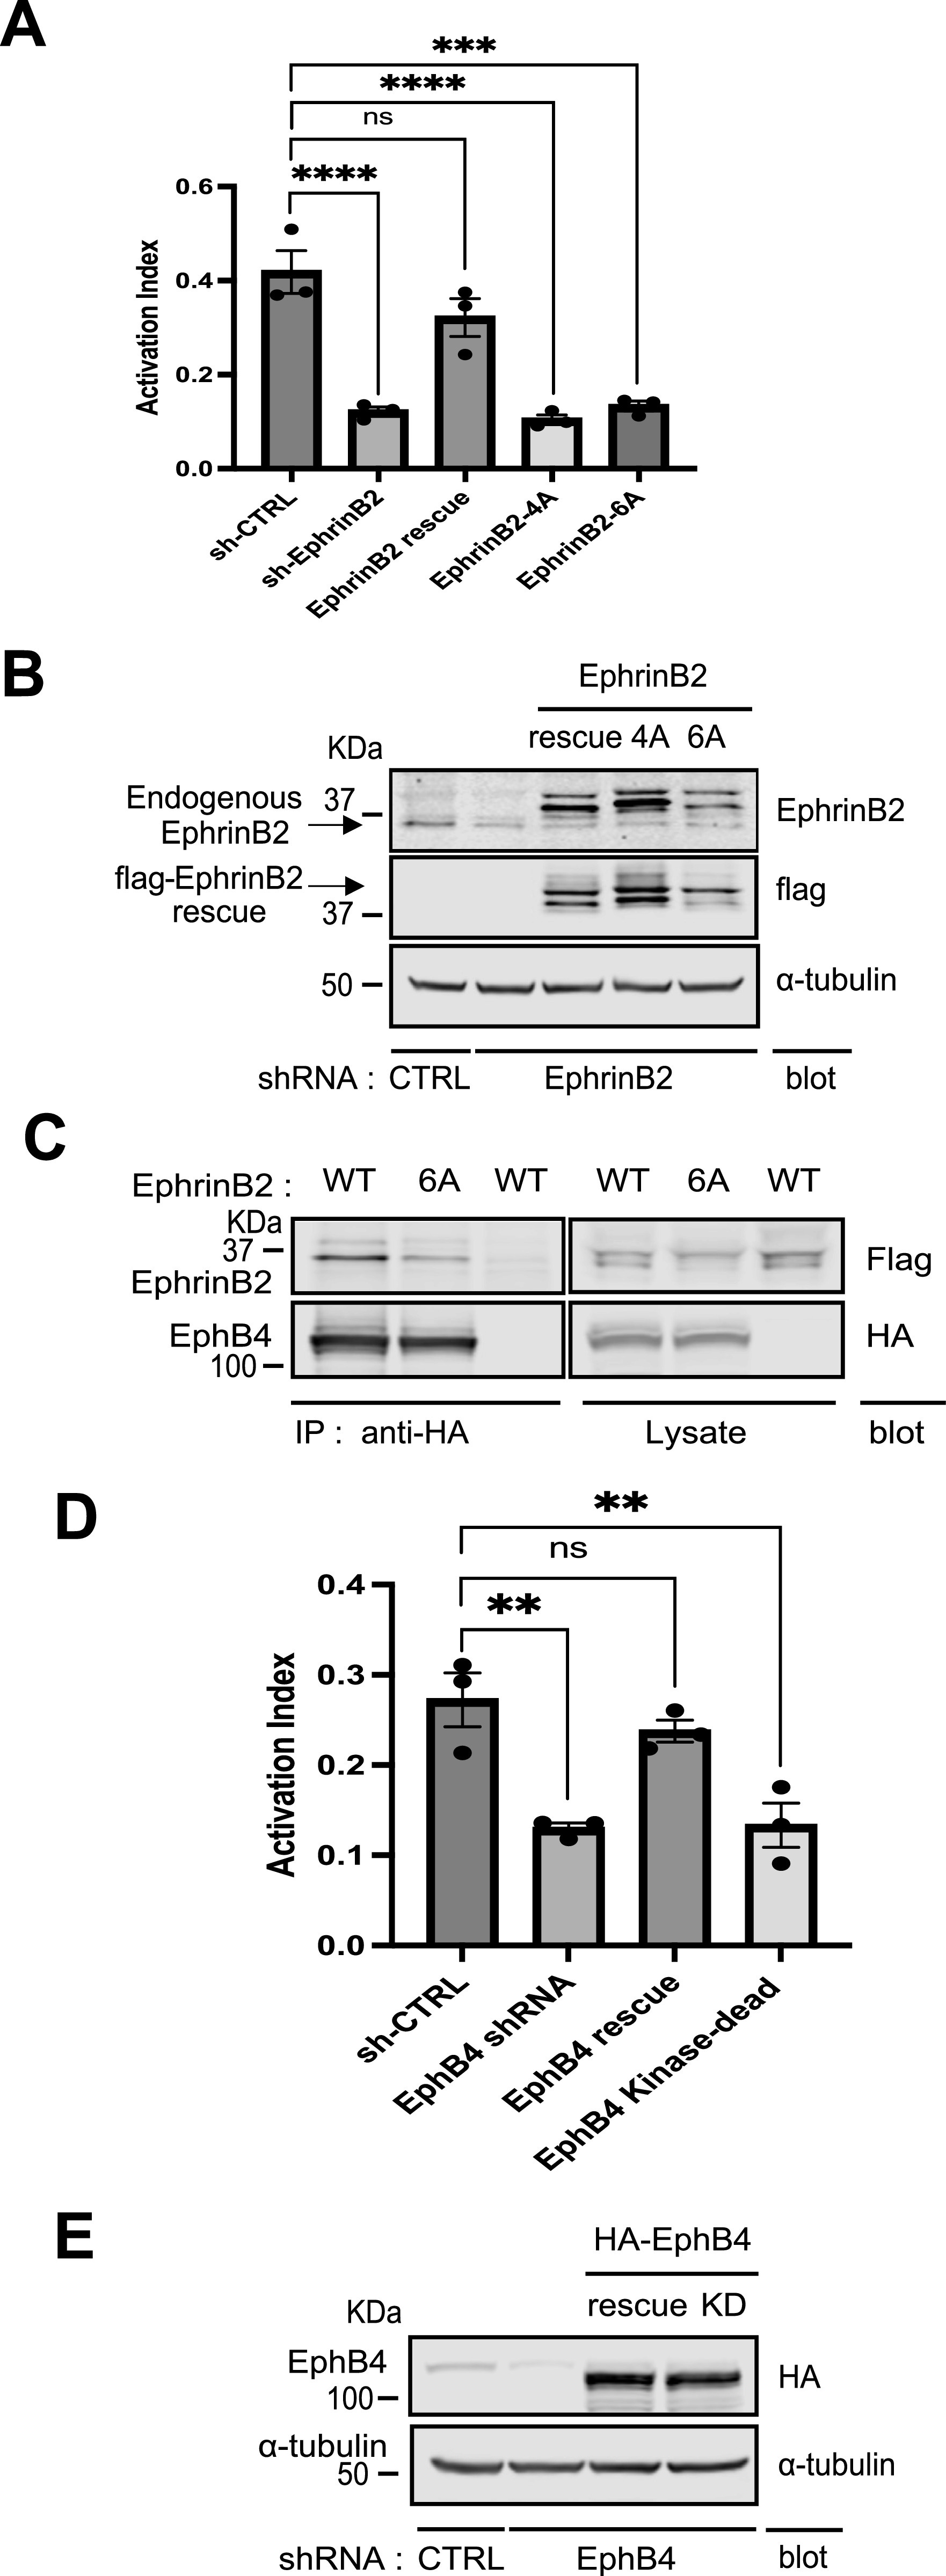
Figure 4.
(A) Silencing ephrinB2 expression resulted in integrin activation defect. The expression of endogenous ephrinB2 was silenced by lentivirus-based RNAi in 293 cells expressing constitutively active αIIb(R995A)β3. A scrambled shRNA was used as a negative control. (C) For rescue experiment, cells were transiently transfected with cDNAs encoding empty vector, shRNA-resistant ephrinB2, ephrinB2 (4A), or ephrinB2 (6A, EphB4-binding mutant, shown in (C)), respectively. The binding of PAC1 (activation-specific anti-αIIbβ3 monoclonal antibody) was assessed by FACS analysis. The activation index of transfected cells was calculated as (F - Fo)/(Fm - Fo), in which F is the median fluorescence intensity (MFI) of PAC1 binding; Fo is the MFI of PAC1 binding in the presence of competitive inhibitor (Integrilin, 1 µM); and Fm is the MFI of PAC1 binding in the presence of the integrin-activating antibody anti-LIBS6 (2 µM). Results represent the mean ± SEM (n = 3) (**P < 0.01; one-way ANOVA) (left panel). (B) Expression of ephrinB2 and its mutants was confirmed by immunoblotting of SDS–PAGE-fractionated cell lysates. (C) Co-IP of EphB4 and ephrinB2. Cell lysates were produced from cells co-transfected with HA-EphB4 and flag-ephrinB2 WT or 6A and immunoprecipitated by anti-HA antibody. Captured immunocomplex was washed and separated on SDS–PAGE. Bound ephrinB2 was recognized in Western blot with anti-flag antibody. HA-EphB4 and flag-EphrinB2 WT or 6A were expressed equally well. (D) Knockdown of EphB4 expression caused a defect in integrin activation. Endogenous EphB4 expression was reduced by lentivirus shRNA in the 293(αIIb[R995A]β3) cells. And the cells were transiently transfected with cDNAs encoding empty vector, shRNA-resistant EphB4, or EphB4 kinase-dead mutant, respectively. Integrin activation was assessed by PAC1 (activation-specific anti-αIIbβ3 monoclonal antibody) on FACS analysis. (A) Activation index of transfected cells was calculated as in (A). Results represent the mean ± SEM (n = 3) (**P < 0.01; one-way ANOVA). (E) Expression of EphB4 and its mutants was verified by Western blotting of SDS–PAGE-fractionated cell lysates.
Source data are available for this figure.

