
|
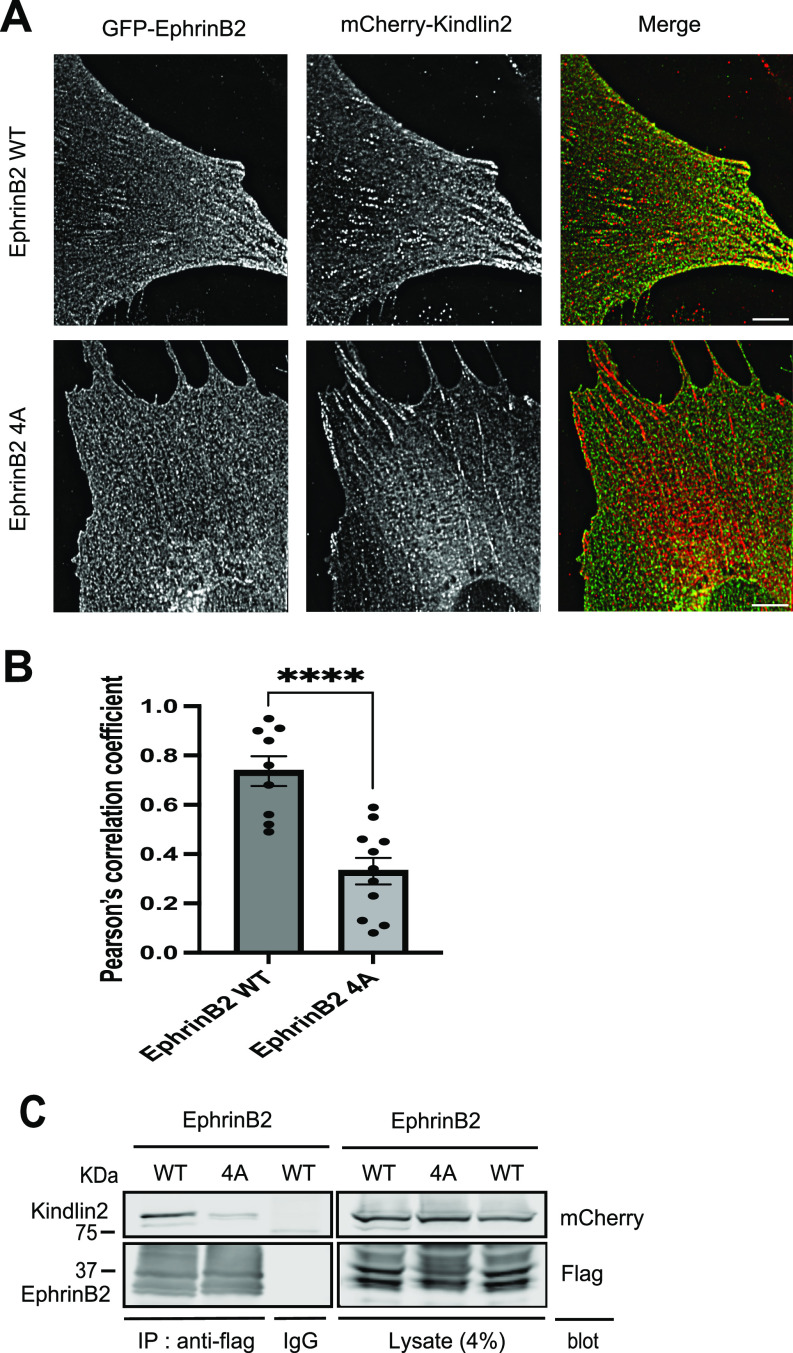
Figure 3.
(A) Kindlin2 co-localizes with ephrinB2 in adhesive structures. NIH3T3 cells were co-transduced by lentivirus particles expressing mCherry-kindlin2 with GFP-ephrinB2 WT or 4A, respectively. The cells were plated on laminin-coated wells. Localization of the two proteins was visualized by an TIRF microscope. Scale bar, 6 µm. (B) Co-localization of kindlin2 with ephrinB2 WT or 4A was measured as the mean values of Pearson’s correlation coefficient on TIRF images. EphrinB2 WT, n = 9; EphrinB2 4A, n = 11. The data are presented as the mean ± SEM. Statistical analysis used an unpaired two-tailed t test. ****P < 0.0001. (C) mCherry-kindlin2 was co-transfected into HEK293 cells with flag-ephrinB2, flag-ephrinB2 (4A), or flag-integrin β1 as a positive control. The cells were lysed, and flag-tagged proteins were immunoprecipitated by anti-flag antibody or control IgG as a negative control. The immunocomplexes were washed and separated on SDS–PAGE. Associated kindlin2 was recognized by anti-mCherry antibody in Western blot. All proteins were expressed equally well.
Source data are available for this figure.