
- Title
-
Immunoglobulin VDJ repertoires reveal hallmarks of germinal centers in unique cell clusters isolated from zebrafish (Danio rerio) lymphoid tissues
- Authors
- Waly, D., Muthupandian, A., Fan, C.W., Anzinger, H., Magor, B.G.
- Source
- Full text @ Front Immunol
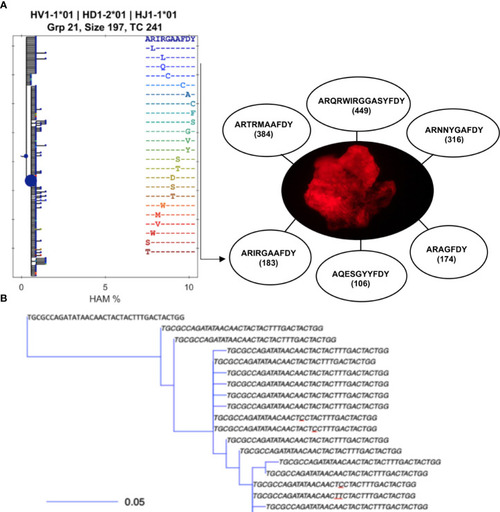
B-cell clonotypes proliferate within MMΦCs while acquiring mutations in the variable region of Ig genes. (A) Translated sequences of the CDR3 of the dominant clones within a single MMΦC (F4UKCa) and the number of putative daughter cells. Lineage tree using BRILIA shows only the different CDR3 sequences (there are 183 unique sequences in this clone but only 24 unique CDR3 sequences). Each dot of the left hand tree represents a unique sequence, and each dot color corresponds to a unique CDR3 sequence. The dot size reflects the total copy number of each sequence. The x-axis shows the percent of Hamming distance calculated based on the number of nucleotides at which two sequences of the same length differ. (B) An example of part of a smaller lineage tree using BuildTrees, IgPhyML (HLP19 model) and Alakazam (igraph), CDR3 nucleotide sequences of all the unique sequences (the size of this sub-clone is 35 sequences). A few of the CDR3 sequences are unique to specifc sequences with mutated nucleotides (underlined nucleotides). Some branches have their defining mutation outside of the CDR. The scale bar represents the branch length (expected number of substitutions per codon site). The analysis was done using IgPhyML and BRILIA. HAM %, is the percent of Hamming distance which is calculated based on the number of nucleotides at which two sequences of the same length differ. |
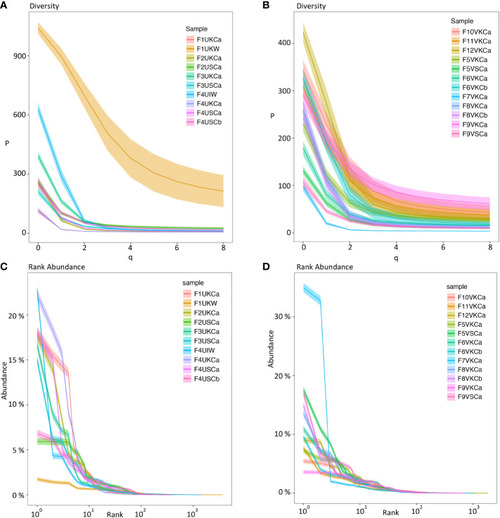
Diversity index (qD) (Hill numbers) (A, B) and clonal (rank) abundance curves (C, D) using Ig sequences from MMΦCs and whole kidney and intestine. (A, C) MMΦCs from unvaccinated zebrafish and the whole kidney and intestine. (B, D) MMΦCs from vaccinated zebrafish. qD is the diversity number, q values are the order of the diversity number. q = 0 is the total number of species in a sample, q = 1 is the exponential of Shannon’s entropy index (considers species in proportion to their frequency), and q = 2 is the inverse of Simpson’s concentration index (considers species in proportion to their frequency and ignores rare species). q=∞ is the reciprocal of the proportional richness of the commonest species. Rank abundance is the Ig clone size as a percent of the repertoire. The shaded areas are 95% confidence intervals. The analysis was performed using Alakazam. Sample designations are (fish number, vaccination status, & tissue source): F# - Fish #; U/V - Unvaccinated/Vaccinated; cluster from K/S - Kidney/Spleen and cluster # - a/b; or W -whole tissue; I - intestine. |
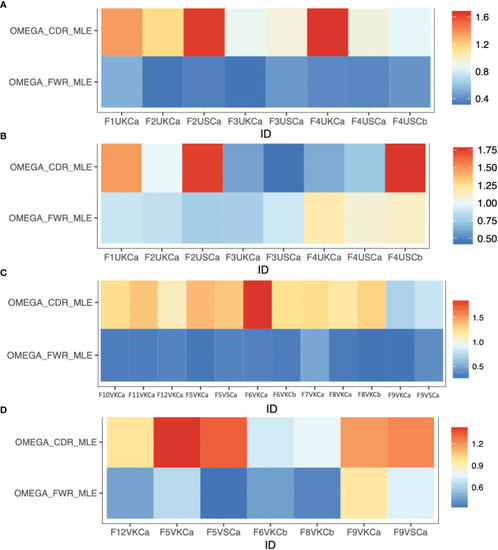
Selection estimates (the ratio of replacement to silent mutations, R/S) for CDRs (ωCDR) and FWRs (ωFWR) using Ig repertoires isolated from MMΦCs from zebrafish. (A) Unvaccinated (IgM isotype). (B) Unvaccinated (IgZ isotype). (C) Vaccinated (IgM isotype). (D) Vaccinated (IgZ isotype). Refer to Table S1 for detailed descriptions of the samples used. The analysis was performed using IgPhyML HLP19 model. |
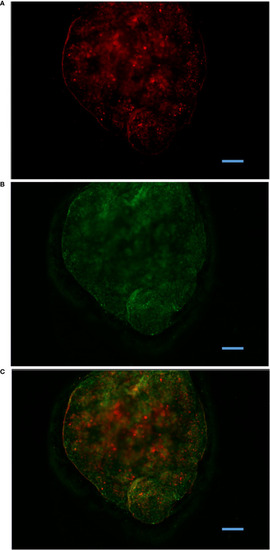
Antigen retention within MMΦC isolated from zebrafish spleen. Spleen MMΦC isolated from zebrafish immunized with BSA-Alexa647, one month following the vaccination. (A) BSA-Alexa-647 is visible in the Cy5 channel. (B) Auto-fluorescent MMΦs are visible in the FITC channel. (C) Merge. Alexa647 was only observed in clusters, and not in surrounding tissues. |

Retention of experimentally injected labeled antigen by MMΦs. Leukocytes were isolated from goldfish or zebrafish spleen and kidney 14 days after immunization with BSA-Alexa-647. Red (TRITC) and green (FITC) are MMΦ auto-fluorescence, while BSA-Alexa 647 is seen in the Cy5 channel. Distinct blue spots in the merged image indicate the signal from Alexa-fluor 647. (A, B) Kidney and spleen leukocytes isolated from immunized goldfish. (C) Kidney leukocytes isolated from zebrafish immunized with Alexa-647. Scale bars are 10 µm. |
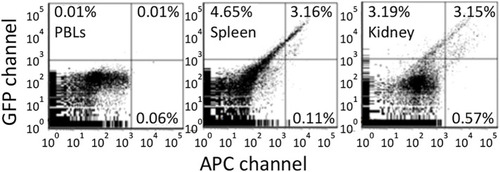
Antigen retention of far red tagged keyhole limpet hemocyanin (KLH) by melano-macrophages from immunized goldfish. Goldfish were immunized with KLH and boosted once over a year. These goldfish were then injected with Alexa Fluor 647 tagged KLH and FACS analyzed 13 days later. Green fluorescence is in the GFP channel while far red is done in the APC channel. Background fluorescence was determined using peripheral blood leukocytes. Spleen and Kidney leukocytes contained approximately 3% double positive and <1% single far red positive cells. |