
Figure 2
- ID
- ZDB-FIG-221227-26
- Publication
- Waly et al., 2022 - Immunoglobulin VDJ repertoires reveal hallmarks of germinal centers in unique cell clusters isolated from zebrafish (Danio rerio) lymphoid tissues
- Other Figures
- All Figure Page
- Back to All Figure Page
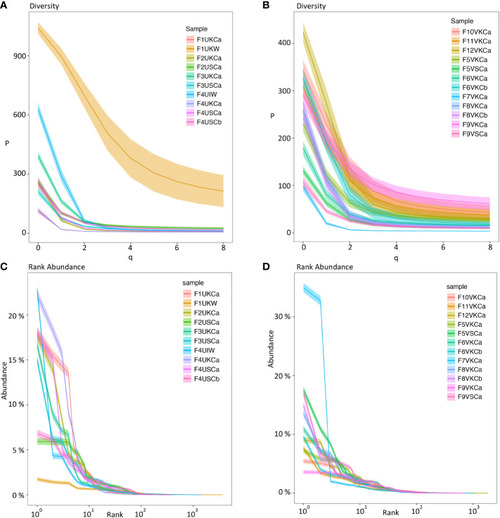
Diversity index (qD) (Hill numbers) (A, B) and clonal (rank) abundance curves (C, D) using Ig sequences from MMΦCs and whole kidney and intestine. (A, C) MMΦCs from unvaccinated zebrafish and the whole kidney and intestine. (B, D) MMΦCs from vaccinated zebrafish. qD is the diversity number, q values are the order of the diversity number. q = 0 is the total number of species in a sample, q = 1 is the exponential of Shannon’s entropy index (considers species in proportion to their frequency), and q = 2 is the inverse of Simpson’s concentration index (considers species in proportion to their frequency and ignores rare species). q=∞ is the reciprocal of the proportional richness of the commonest species. Rank abundance is the Ig clone size as a percent of the repertoire. The shaded areas are 95% confidence intervals. The analysis was performed using Alakazam. Sample designations are (fish number, vaccination status, & tissue source): F# - Fish #; U/V - Unvaccinated/Vaccinated; cluster from K/S - Kidney/Spleen and cluster # - a/b; or W -whole tissue; I - intestine. |