
- Title
-
Valproic acid affects neurogenesis during early optic tectum development in zebrafish
- Authors
- Dixon, S.C., Calder, B.J., Lilya, S.M., Davies, B.M., Martin, A., Peterson, M., Hansen, J.M., Suli, A.
- Source
- Full text @ Biol. Open
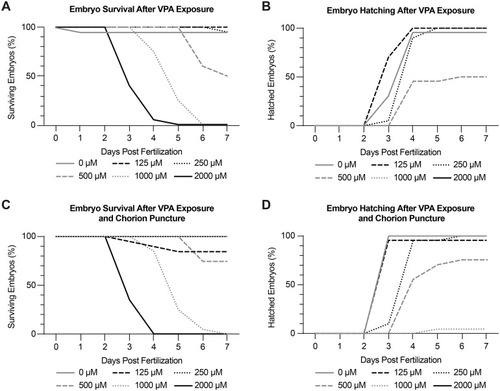
Dose-response experiments identify 250 μM VPA as the maximum tolerated dose (MTD). Embryo survival (A) and hatching (B) were recorded daily from 0-7 dpf using concentrations of VPA ranging from 0-2000 μM. Treated embryos were continuously exposed to VPA from 6-120 hpf. 250 μM was found to be the MTD due to high embryo survival (A) and hatching (B). (C-D) Because zebrafish embryos are encased in a chorion until around 72 hpf, we wondered if VPA was not able to reach the embryos while they were in their chorion. As a result, we repeated the dose-response experiments in embryos where the chorion was punctured. We found no appreciable difference in survival or hatching in embryos with intact or punctured chorions, showing that we could treat the embryos during the early stages without having to remove the chorion. Experiments were repeated twice with 10 embryos per treatment each time. |
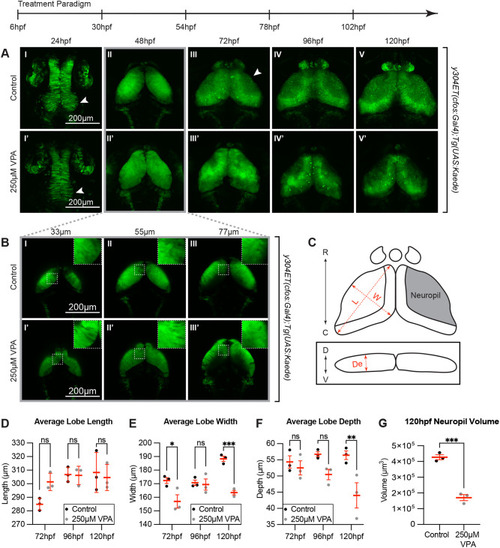
Continuous VPA treatment causes delayed OT development and decreased neuropil. (A) Daily images of control (I-V) and 250 µM VPA-treated y304Et(cfos:Gal4); Tg(UAS:Kaede) embryos (I′-V′). Treated embryos were continuously exposed to VPA from 6-120 hpf. At 24 hpf, proliferation in the neuroepithelium giving rise to the OT is seen in control (arrow, I) but not in treated embryos (arrow, I′). Beginning at 72 hpf, the OT neuropil, where the neurites extend, becomes noticeable in control (arrow, III) but not in treated larvae (III′). (B) Images of single slices of dorsal (33 µm) to ventral (77 µm) positions at 48 hpf in OT of control (I-III) and VPA-treated embryos (I′-III′). Neurogenesis in treated embryos appears delayed as shown by the presence of columnar neuroepithelial cells dorsally in treated embryos (I′, inset in I′) but not in control embryos where neuroprogenitors and early-born neurons (rounded cells) have taken their place (I, inset in I, and Fig. 3; insets are zoomed in areas from the dashed-line ROIs). (C) Cartoon of OT lobe measurements of length, width, and depth. (D) The lobe length of treated larvae is not significantly different than controls. R: rostral, C: caudal, D: dorsal, V: ventral, L: length, W: width, De: depth. (E) Lobe width of treated embryos is significantly decreased at 72 hpf and 120 hpf, while depth is significantly decreased at 120 hpf (F). (G) Neuropil volume is decreased in VPA-treated larvae at 120 hpf. Although these observations were seen in three different week-long experiments (three embryos per experiment and experimental condition), the quantification was done in three embryos from the same experimental week. Different embryos/larvae were imaged each day and euthanized at the end of the imaging session. Data are shown as mean±s.e.m. A two-way ANOVA with Šidák's multiple comparisons test was performed in D-F, and a two-tailed unpaired t-test was performed in G. At 48 hpf, length, width, and depth are difficult to measure since during this time neuroepithelium is transitioning into neuroblasts. *P<0.05; **P<0.01, ***P< 0.001. |
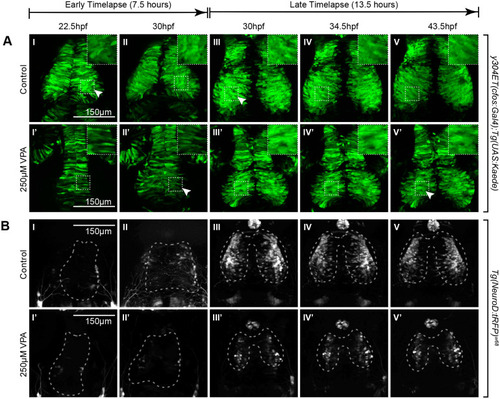
Timelapse imaging between 22.5-30 hpf and between 30-43.5 hpf shows a delay in neuronal differentiation and specification in VPA-treated embryos. (A I-II, I′-II′) Timelapse imaging of VPA-treated and control y304Et(cfos:Gal4); Tg(UAS:Kaede) embryos at 22.5hpf-30 hpf show that neuroepithelium proliferation (columnar cells) and early neuron generation/differentiation (shorter, rounder cells) is lagging in treated embryos (I′-II′) and is more comparable (arrow, II′) to controls at earlier time points (arrow, I). Insets show a magnified view of the ROIs in dashed lines. (B I-II, I′-II′) At 22.5-30 hpf, no appreciable neuronal specification is seen in either control (I-II) or treated embryos (I′-II′) as determined by lack of fluorescence in the Tg(NeuroD:tRFP)w68 line (dashed outlines indicate OT location). (A III-V, III′-V′) At 30-43.5 hpf, neuroepithelium proliferation and neuron generation/differentiation continues to lag in treated embryos (arrow, V′) when compared to controls (arrow, III). During this time, more neurons become specified in controls (B III-V) when compared to VPA-treated embryos (B III′-V′). Fluorescence in controls condenses into the shape of the OT as the timelapse progresses (B III-V). No increase in fluorescence is apparent for the treated embryos through the timelapse duration. (B III′-V′). For each timelapse, the experiment was repeated twice, and three embryos were timelapse-imaged every time. (A II-III, II′-III′; B II-III, II′-III′) Discrepancies in developmental stages between the movies of the two time periods of the same transgenic line result from delays imposed from time away from a controlled incubation environment as the timelapse progressed. |
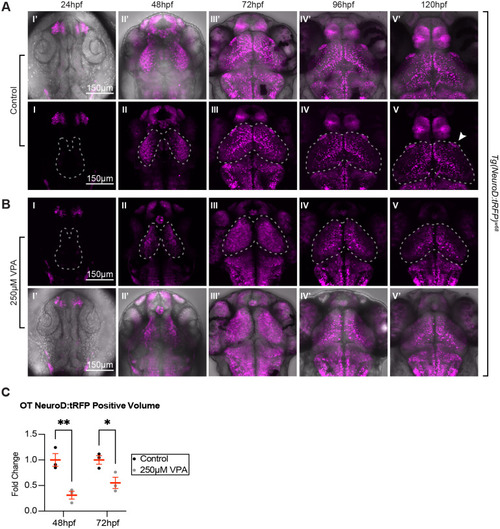
Tg(NeuroD:tRFP)w68 imaging during the first 5 days of development reveals differences in neuronal maturation between control and treated embryos. Similar to Fig. 2, we noticed no appreciable neuronal specification (as assessed by tRFP expression) in control (A I, I′) or treated embryos (B I, I′) at 24 hpf, and more neuronal specification in control (A II, II′) versus treated embryos (B II, II′) at 48 hpf (dashed outlines indicate OT location). As development progressed from 72-120 hpf, tRFP began to be restricted to subsets of neurons in control larvae (A III-V, III′-V′). Instead, in treated larvae, tRFP expression was detected throughout the OT at 72 hpf (B III), which most likely resembles a time point between 48 and 72 hpf in control embryos (not imaged). This expression becomes more restricted at 96-120 hpf (B IV,V,IV′,V′), suggesting that although neuronal specification lags or slows down in treated embryos, it does eventually occur. Whether the OT neurons in treated embryos are specified to become the same subclasses of neurons as in the control embryos remains to be determined. In addition, treated larvae lack expression in arborization field 7 (A F7) (arrow in A V), a pretectal nucleus shown to be involved in hunting behavior, and scattered neuropil expression seen in controls. Panels I′-V′ in both A and B are overlays of fluorescent images on transmitted confocal projections. (C) Quantification of the volume of tRFP positive neurons at 48 hpf and 72 hpf. Since tRFP is localized in the cytoplasm, it wasn't possible to count tRFP positive neurons. Therefore, we quantified the tRFP positive volume of control and treated embryos, and found that the tRFP positive volume is significantly smaller in treated embryos when compared to controls. Although these observations were seen in three different week-long experiments (three embryos per experiment and experimental condition), the quantification was done on three embryos from the same experimental week. Data are shown as mean±s.e.m. A two-way ANOVA with Šidák's multiple comparisons test was used for statistical analysis. *P<0.05, **P<0.01. |
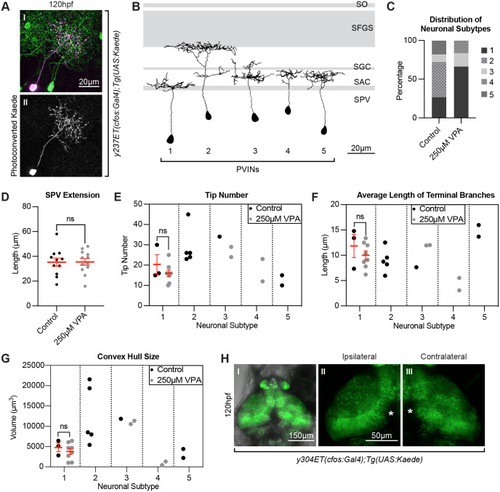
Photoconversions of neurons in the OT of VPA-treated embryos reveal shortened and less complex neuronal projections. (A) Photoconversion of Kaede (II) from green to red (pseudo-colored magenta) (I) was carried out in single neurons in 5 dpf larvae in the y237Et(cfos:Gal4); Tg(UAS:Kaede) line, which labels only a few OT neurons. Eleven neurons from control larvae and twelve neurons from 250μM VPA-treated larvae were photoconverted and traced using the SNT macro, Fiji (ImageJ). (B) The presence of five different periventricular interneuron (PVIN) subtypes which extend projections in different layers of the neuropil were detected. Panel based on (Nevin et al., 2010) with OT retinoreceptive laminae shown in gray. SPV: stratum periventriculare; SAC: stratum album centrale; SGC: stratum griseum centrale; SFGS: stratum fibrosum et griseum superficiale; SO: stratum opticum. (C) Most of the photoconverted neurons in control larvae were of subtype 2 [which extend their projections to the more distal laminae SFGS (n=5)] and subtype 1 (n=3), fewer of subtype 5 (n=2) and subtype 3 (n=1), with no subtype 4 neurons. In the treated larvae, most of the neurons were of subtype 1 (n=8) and few of subtype 3 (n=2) and subtype 4 (n=2), with no subtype 2 or subtype 5 neurons. (D) The distance of the photoconverted PVIN cell bodies to the start of the neuropil, on the other hand, was not different between control and treated larvae. All neuronal subtypes were combined for this analysis (control n=11) (250 µM VPA, n=12). Data are shown as mean±s.e.m. A two-tailed unpaired t-test was used to determine significance. *P<0.05, **P<0.01, ***P<0.001. Using SNT macro, Fiji (ImageJ), on the traced neurons for each neuronal subtype in control and treated conditions, we calculated the tip number (E), average length of terminal branches (F), and convex hull size (G), which indicates the total volume of the arborization field. Since we did not have enough neurons representing each subtype in control and treated conditions, we only compared these parameters in subtype 1 neurons and found them to be not statistically different from one another. (Each dot represents one neuron). Data shown as mean±s.e.m. A two-tailed unpaired t-test with Welch's correction was used to determine significance ***P<0.001. (H I) Unilateral enucleations (eye removals) (left), show that both ipsilateral (H II) and contralateral (H III) OT neuropils are identical to each other, indicating that the status of retinotectal axons is not integral to the initial development of OT neuron projections. This suggests that VPA effects on the OT are not due to possible VPA effects on retinotectal projections from the retina, as seen in other studies (Cowden et al., 2012). (H II and H III) zoomed in views of H I. * in H II and H III indicate pigment spots concealing the structures below. |
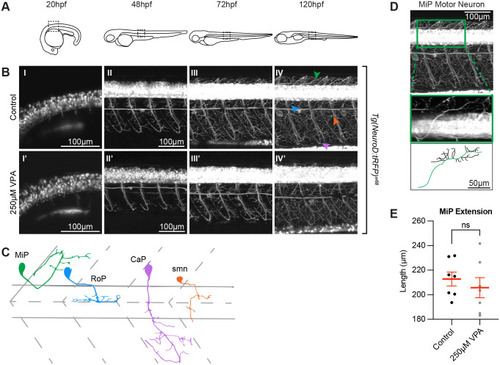
VPA effects do not extend to all neurons in the embryo. (A) Schematic of the imaging location at the different time points in embryos and larvae. Images of the spinal cord neurons in the Tg(NeuroD:tRFP)w68 line indicate that neurogenesis (B) is occurring at the same time (∼20 hpf) in control (I) and treated embryos (I′). Moreover, despite being somewhat delayed, axonogenesis and dendritogenesis in treated embryos (II′-IV′) does not look significantly different when compared to controls (II-IV) from 48-120 hpf. (C) Cartoon of MiP, RoP, CaP, and smn motor neurons based on (Myers et al., 1986). Initially we thought that the dorsal projections of MiP motor neurons in the treated larvae were affected. However, when we used Fiji's (ImageJ) SNT macro, to trace the neurons in three dimensions (D), and measure the length of the primary projection (green trace in the cartoon), we found that the differences between control and VPA-treated embryos were not statistically different from one another (E). Two to three MiPs were traced in each embryo and three embryos per condition were analyzed. (Each dot represents one MiP). Data shown as mean±s.e.m. A two-tailed unpaired t-test was used to determine significance. (*) in IV′ indicate pigment spots concealing the structures below. Due to the high fluorescence level in the neuronal cell bodies, gamma has been adjusted (0.60) uniformly on all images in panel B to allow for visualization of neuronal projections. |
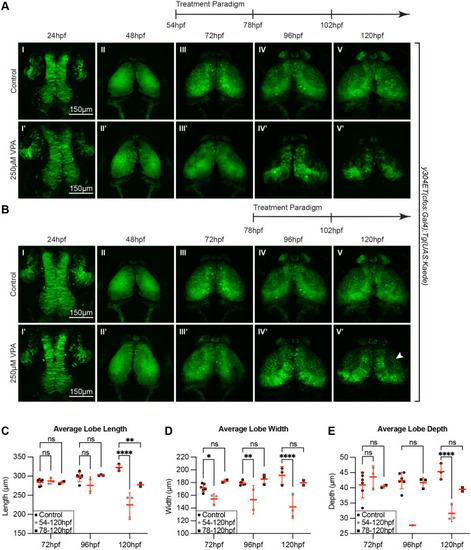
The critical window of OT susceptibility to VPA-treatment includes timepoints prior to 72 hpf. (A) Treatment of y304Et(cfos:Gal4); Tg(UAS:Kaede) embryos from 54 to 120 hpf still resulted in neuropil development defects in the treated embryos (I′-V′) compared to controls (I-V). Therefore, the critical window of susceptibility must extend beyond 54 hpf. (B) A subsequent trial in which VPA treatment was initiated at 78 hpf resulted in a significantly reduced phenotype in treated larvae (IV′-V′). Three embryos per experimental condition were imaged and quantified. (C) Average lobe length at 120 hpf was significantly decreased for both treatment groups. (D) Average lobe width is consistently decreased for the 54-120 hpf treatment group across all days measured. (E) The average lobe depth is significantly decreased for the 54-120 hpf treatment group compared to controls when measured at 96 and 120 hpf. The 78-120 hpf treatment group shows no significant difference with controls. Therefore, the critical window of susceptibility is determined to be time points prior to 72 hpf. At 48 hpf, length, width and depth are difficult to measure since during this time neuroepithelium is transitioning into neuroblasts. A two-way ANOVA with Šidák's multiple comparisons test was performed. *P<0.05, **P<0.01, ***P<0.001, ****P<0.0001. Data are shown as mean±s.e.m. |
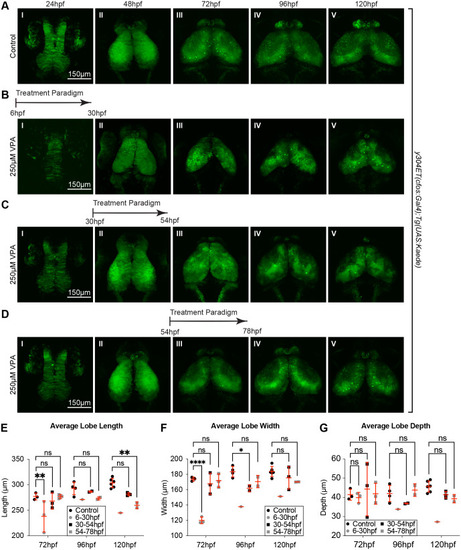
Single 24 h VPA treatment prior to 78 hpf still result in developmentally delayed OTs. Short, 24 h VPA treatments were administered during three different time-windows followed by replacement of the solution with EM. Daily imaging of control (A) and 250 µM VPA-treated y304Et(cfos:Gal4); Tg(UAS:Kaede) embryos show that one 24 h VPA-treatment at 6-30 hpf (B) or 30-54 hpf (C) still leads to a smaller OT and neuropil (B. II-V, C. III-V, E,F,G) and that the development, despite the shorter treatment time, did not recuperate. (D) When the VPA-treatment was applied between 54-78 hpf, OT development was affected less than in previous treatments (B,C). (E, F,G) Three embryos per experimental condition were imaged and quantified (except for the 6-30 hpf group, where the image from only one embryo prevented analysis at 96 hpf and 120 hpf). At 48 hpf, length, width, and depth are difficult to measure since during this time neuroepithelium is transitioning into neuroblasts. A two-way ANOVA with Šidák's multiple comparisons test was performed in E-G *P<0.05, **P<0.01, ***P<0.001, ****P<0.0001. Data are shown as mean±s.e.m. |
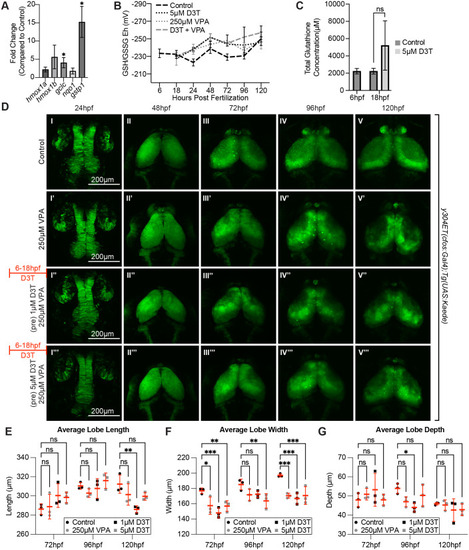
Induction of genes downstream of the antioxidant-response transcription factor, nrf2, do not protect against VPA effects in the OT. (A) Treatment of embryos from 6-18 hpf with 5 µM D3T induces expression of some genes (Gclc and Gstp1 that play a direct role in reduced glutathione (GSH) synthesis and usage) downstream of nrf2 transcription factor gene in total embryos. (B) However, pretreatment for 12 h with 5 µM D3T before incubation with 250 µM VPA did not significantly change the redox potential when compared to VPA only treated embryos at any of the tested time points (C). Data points (A-C) represent n=3 pools of 30 embryos. *P<0.05. Data are shown as mean±s.e.m. (D) Pretreatment for 12 h with 1μM (I″-V″) or 5 μM (I′′′-V′′′) D3T before incubation with 250 μM VPA provides no protection in the OT compared to embryos treated with VPA alone (I′-V′) despite upregulation of nrf2 target genes. (E) Average lobe length is significantly decreased for the 1 µM D3T treatment group, compared to controls, when measured at 120 hpf. (F) For the average lobe width, all treatment groups were significantly decreased compared to controls when measured at 72 hpf and 120 hpf. When measured at 96 hpf the 5 µM D3T treatment groups was significantly decreased compared to controls. (G) Average lobe depth was significantly decreased compared to the controls for the 1 µM D3T treatment group when measured at 96 hpf. At 48 hpf, length, width and depth are difficult to measure since during this time neuroepithelium is transitioning into neuroblasts). In E-G a two-way ANOVA with Šidák's multiple comparisons test was used for statistical analysis *P<0.05, **P<0.01, ***P<0.001. Data are shown as mean±s.e.m. |